
E7 Indicators Free Overlays
Индикатор
377 скачивания
Версия 1.0, Feb 2025
Windows, Mac
5.0
Отзывы: 2
Описание
Бесплатные индикаторы наложения E7 включают только следующее
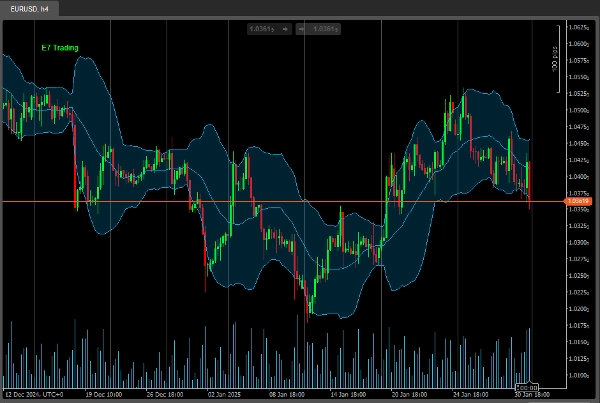
- Облако полос Боллинджера
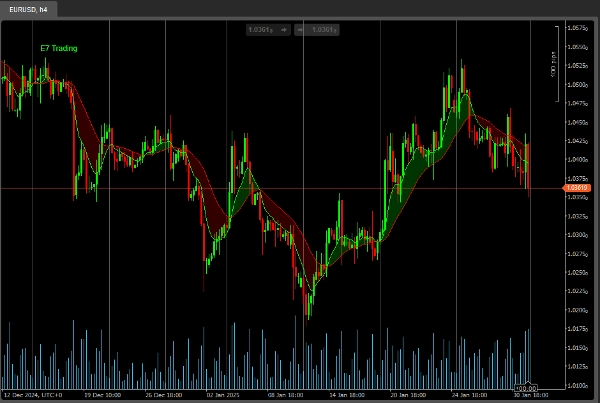
- Хейкен Аши
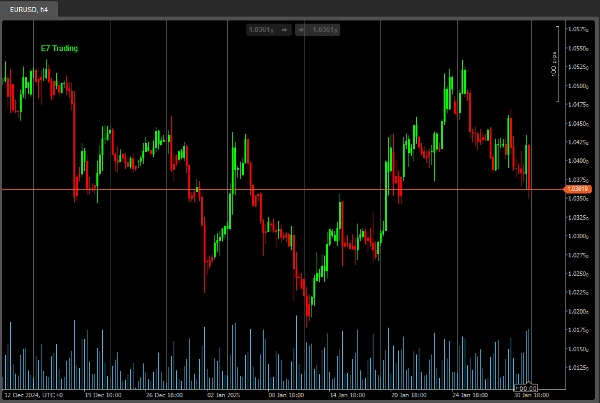
- Следящий тренд
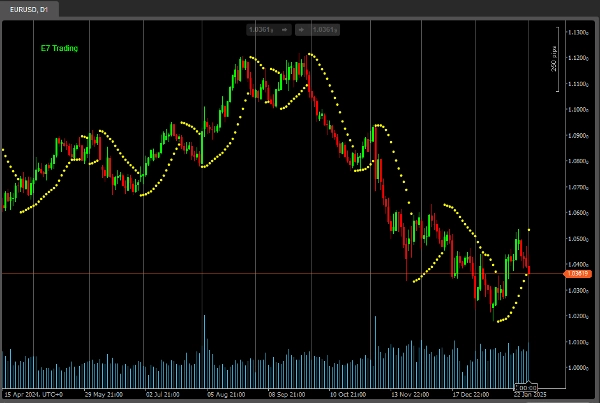
- Параболический SAR.
Удачной охоты!
Сводка
ИИ-сводка
E7 Indicators Free Overlays is a collection of four technical overlay indicators designed for trading chart analysis. It includes the Bollinger Band Cloud, which visualizes volatility and potential price ranges; Heiken Ashi, a candlestick variant that smooths price action to identify trends; Trend Follower, an indicator aimed at highlighting prevailing market directions; and Parabolic SAR, which signals potential trend reversals and helps set trailing stop levels. These overlays are applied directly on price charts to assist traders in identifying market trends, volatility, and entry or exit points. The product supports multiple chart types and is suitable for various trading instruments where these indicators are applicable.
Профиль индикатора
Отзывы покупателей
5.0
Отзывы: 2
5 | 100 % | |
4 | 0 % | |
3 | 0 % | |
2 | 0 % | |
1 | 0 % |
Отзывы покупателей
December 21, 2025
August 18, 2025
Combines multiple tools in one, customizable, versatile. Cons: Can overload chart, slight lag with all features enabled.
Обсуждение
Частые вопросы
Bollinger
Продукты, доступные в cTrader Store, включая торговых ботов, индикаторы и плагины, предоставляются сторонними разработчиками и доступны исключительно в информационных и технических целях. cTrader Store не является брокером и не предоставляет инвестиционные консультации, персональные рекомендации или какие-либо гарантии будущей доходности.
Больше от этого автора


Цена
С 18/12/2024
2
Продажи
4.25K
Бесплатные установки