
KeyLevels
อินดิเคเตอร์
328 ดาวน์โหลด
เวอร์ชัน 1.0, Nov 2025
Windows, Mac
คำอธิบาย
ภาพรวม
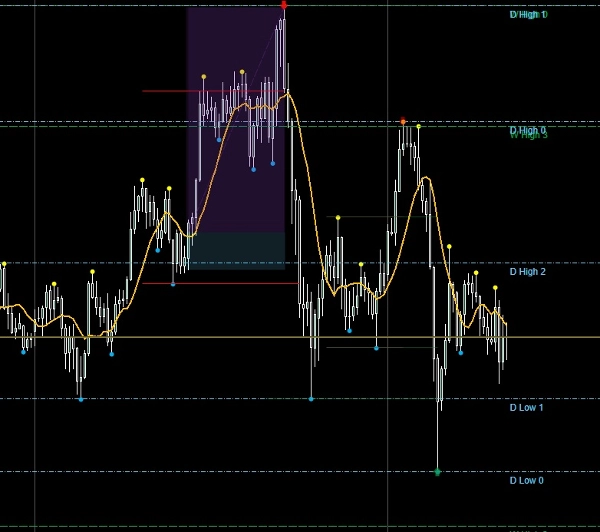
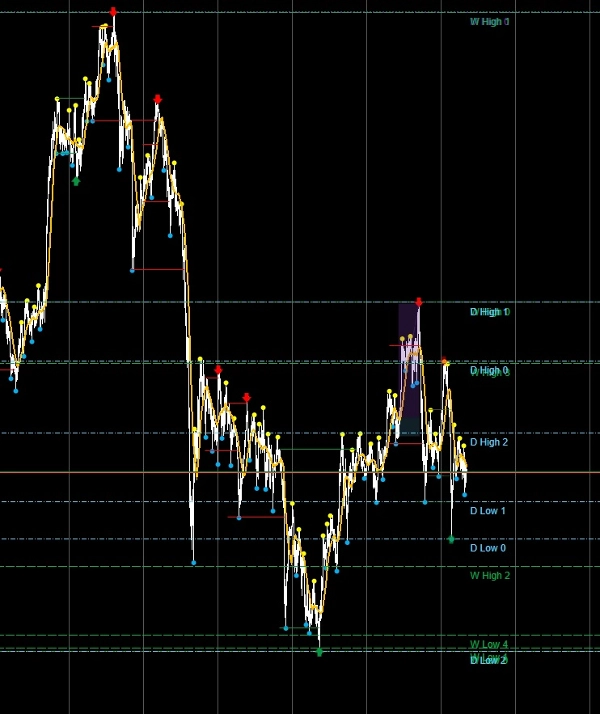
ตัวชี้วัด ระดับสำคัญ ถูกสร้างขึ้นสำหรับเทรดเดอร์ที่พึ่งพาจุดยึดเวลาที่สูงกว่าเพื่อชี้นำการดำเนินการภายในวัน มันจะระบุและวาดเส้นแนวนอนสำหรับจุดสูงสุดและต่ำสุดรายเดือน รายสัปดาห์ และรายวันโดยอัตโนมัติ ให้คุณรับรู้โครงสร้างได้ทันทีในหลายกรอบเวลา แต่ละระดับสามารถปรับแต่งได้อย่างเต็มที่ เพื่อให้คุณสามารถปรับภาพให้ตรงกับคู่มือและกระบวนการทำงานของคุณ
คุณสมบัติหลัก
- 🔹 ระดับหลายกรอบเวลา – วาดจุดสูงสุดและต่ำสุดจากแท่งรายเดือน รายสัปดาห์ และรายวัน
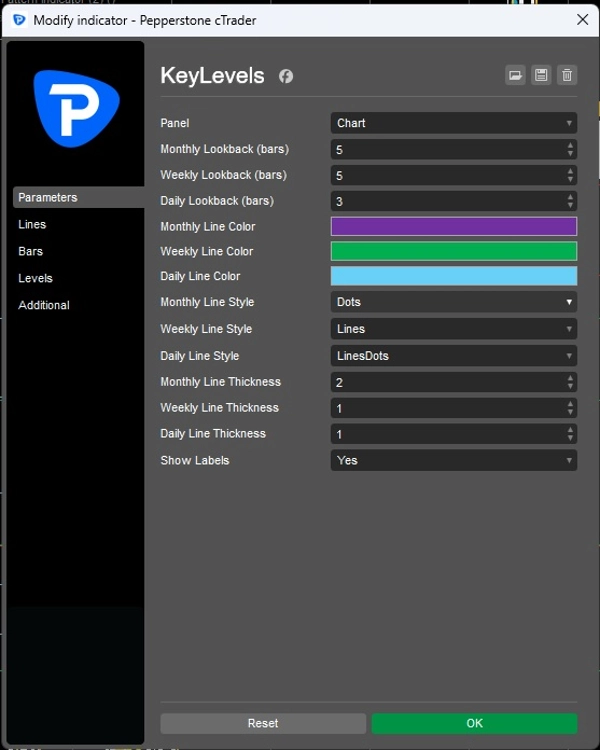
- 🔹 ช่วงเวลาย้อนหลังที่กำหนดเอง – เลือกจำนวนแท่งที่ผ่านมาเพื่อรวมสำหรับแต่ละกรอบเวลา
- 🔹 การปรับแต่งภาพ – ตั้งค่าสี รูปแบบเส้น และความหนาแต่ละระดับสำหรับรายเดือน รายสัปดาห์ และรายวัน
- 🔹 ตัวเลือกป้ายชื่อ – เปิด/ปิดป้ายชื่อเพื่อการระบุแต่ละระดับอย่างชัดเจน
- 🔹 การอัปเดตแบบไดนามิก – ระดับจะรีเฟรชโดยอัตโนมัติเมื่อแท่งใหม่ปิด
- 🔹 การผสานรวมแผนภูมิที่สะอาด – เส้นถูกวาดตรงบนแผนภูมิของคุณเพื่อการอ้างอิงที่ง่าย
ประโยชน์สำหรับเทรดเดอร์
- ยึดการตั้งค่าภายในวันของคุณกับ ระดับเวลาที่สูงกว่าอย่างเป็นวัตถุประสงค์.
- เสริมสร้าง วินัยและตัวกรองความเชื่อมั่น โดยแสดงเฉพาะจุดโครงสร้างสำคัญ
- ประหยัดเวลาโดยการวาดระดับอัตโนมัติ — ไม่ต้องวาดด้วยมืออีกต่อไป
- เพิ่มความชัดเจนเมื่อรวมการวิเคราะห์หลายกรอบเวลา
กรณีการใช้งาน
- นักเก็งกำไรภายในวันสามารถจัดตำแหน่งการเข้าเทรดให้ตรงกับระดับรายวันหรือรายสัปดาห์
- นักเทรดสวิงสามารถติดตามจุดยึดรายเดือนสำหรับการตั้งค่าต่อเนื่อง
- เทรดเดอร์ที่ใช้คู่มือสามารถรวมตัวชี้วัดนี้เข้ากับรายการตรวจสอบแบบรวมเพื่อการจัดประเภททันที
สรุป
โปรไฟล์อินดิเคเตอร์
รีวิวจากลูกค้า
0.0
รีวิว: 0
รีวิวจากลูกค้า
ยังไม่มีรีวิวสำหรับผลิตภัณฑ์นี้ หากเคยลองแล้ว ขอเชิญมาเป็นคนแรกที่บอกคนอื่น!
การสนทนา
คำถามที่พบบ่อย
BTCUSD
Forex
Signal
Breakout
Indices
EURUSD
Commodities
GBPUSD
NZDUSD
Prop
Scalping
Crypto
Stocks
XAUUSD
NAS100
USDJPY
ผลิตภัณฑ์ที่มีให้บริการผ่าน cTrader Store รวมถึงบอทการเทรด อินดิเคเตอร์ และปลั๊กอิน มีให้บริการโดยนักพัฒนาบุคคลที่สามและมีไว้เพื่อวัตถุประสงค์ในการเข้าถึงข้อมูลและทางเทคนิคเท่านั้น cTrader Store ไม่ใช่โบรกเกอร์และไม่ได้ให้คำแนะนำการลงทุน คำแนะนำส่วนบุคคล หรือการรับประกันผลการดำเนินงานในอนาคต
เพิ่มเติมจากผู้เขียนคนนี้


ราคา
ตั้งแต่ 24/04/2025
168.09M
ปริมาณการเทรด
17.73K
Pips ที่ได้กำไร
11
การขาย
328
ติดตั้งฟรี