คำอธิบาย
- คำนวณ **Bollinger Bands** 📊 โดยอิงจากค่าเฉลี่ยเคลื่อนที่อย่างง่าย (SMA) และส่วนเบี่ยงเบนมาตรฐานของราคาปิด
- คำนวณ **Keltner Channels** 📈 โดยใช้ค่าเฉลี่ยเคลื่อนที่และช่วงจริงหรือช่วงระหว่างราคาสูงสุดและต่ำสุด
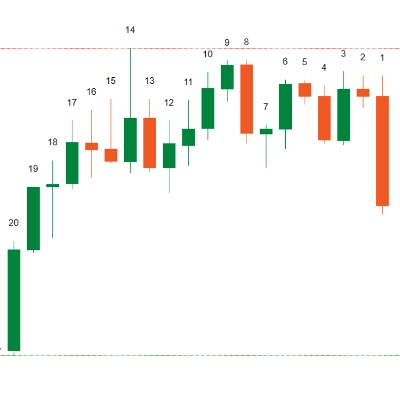
- จากนั้น ตัวบ่งชี้จะวัด **โมเมนตัม** ⚡ โดยคำนวณความแตกต่างระหว่างราคาปิดปัจจุบันกับค่าเฉลี่ยของราคาสูงและต่ำล่าสุด พร้อมแสดงเป็น **ฮิสโตแกรม**:
- **สีเขียว** สำหรับโมเมนตัมบวก 📈
- **สีแดง** สำหรับโมเมนตัมลบ 📉
ฮิสโตแกรมนี้ช่วยให้เห็นภาพความแข็งแกร่งและทิศทางของการเคลื่อนไหวในตลาด ทำให้ง่ายต่อการสังเกตแนวโน้มหรือการเปลี่ยนแปลงในพลวัตของตลาด
🔥 Pinescritlabs
Ctrader Store indicators: 🤖Pinescritlabs Ctrader Store cBots:
Fair Value Gap Sessions Gold & BTC Breakout Session Pivots(new)
Dynamic Market Structure
Analysis of Turning Points
Fibonacci Linear
Regression Multi-timeframe
Multi-Level Candle Bias
Tracker
Auto Support and
Resistance Trend Lines
สรุป
รีวิวจากลูกค้า
5 | 100 % | |
4 | 0 % | |
3 | 0 % | |
2 | 0 % | |
1 | 0 % |