present
ลงทะเบียนและรับส่วนลด $50 สำหรับการซื้อครั้งแรกของคุณ
Trading product for G.A.S - Smart Entry Zone US 500 อินดิเคเตอร์ Key Levels Supply & Demand, image 1
G.A.S - Smart Entry Zone US 500
อินดิเคเตอร์
140 ดาวน์โหลด
เวอร์ชัน 1.2, May 2026
Windows, Mac
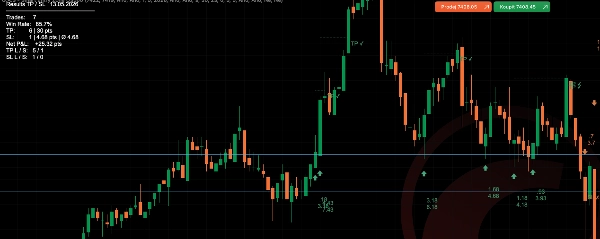
Trading product for G.A.S - Smart Entry Zone US 500 อินดิเคเตอร์ Key Levels Supply & Demand, image 2
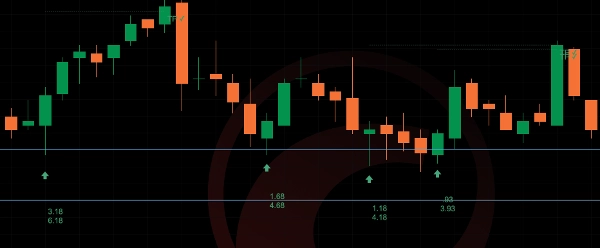
Trading product for G.A.S - Smart Entry Zone US 500 อินดิเคเตอร์ Key Levels Supply & Demand, image 3
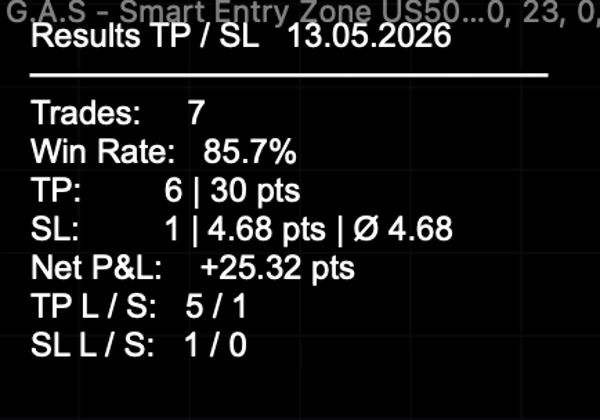
Trading product for G.A.S - Smart Entry Zone US 500 อินดิเคเตอร์ Key Levels Supply & Demand, image 4
Trading product for G.A.S - Smart Entry Zone US 500 อินดิเคเตอร์ Key Levels Supply & Demand, image 5
ตั้งแต่ 29/01/2026
140
ติดตั้งฟรี

คำอธิบาย

G.A.S - Smart Entry Zone เป็นตัวบ่งชี้การเคลื่อนไหวของราคา สำหรับ US500 (S&P 500 CFD) ที่ช่วย

ผู้ซื้อขายระบุจุดเข้าที่มีความน่าจะเป็นสูงรอบโซนราคาที่กำหนดด้วยตนเอง


--- สิ่งที่วิเคราะห์ ---


ตัวบ่งชี้ตรวจสอบพฤติกรรมราคารอบสองระดับแนวนอนที่ผู้ใช้กำหนด -

ขอบเขตบนและล่างของ Smart Entry Zone มันติดตามว่าราคามุ่งหน้า,

ทะลุ และตอบสนองต่อระดับเหล่านี้ในแต่ละแท่งเทียน โดยมองหารูปแบบยืนยันเฉพาะก่อนสร้างสัญญาณ


--- วิธีตีความสัญญาณและองค์ประกอบภาพ ---


เส้นโซนแสดงขอบเขตบนและล่างของโซนเข้าซื้อขายสำหรับวันซื้อขายที่เลือก

ตรวจพบสัญญาณสามประเภท:


- กรณี A - ราคาทิ่มผ่านโซนแล้วปิดกลับออกไปข้างนอก แท่งเทียนถัดไปที่ปิดในทิศทางของการเบรกเอาท์จะกระตุ้นสัญญาณ สัญญาณหนึ่งต่อเหตุการณ์ทิ่ม (ครั้งเดียว)


- กรณี B - แท่งก่อนหน้าปิดนอกโซน แท่งปัจจุบันทิ่มผ่านโซนและปิดกลับออกไปข้างนอก ยืนยันการทดสอบขอบเขตโซนอีกครั้ง


- กรณี C - ณ เวลาที่เปิดหน้าต่างสัญญาณ ราคาตั้งอยู่เกินโซนแล้ว แท่งเทียนยืนยันแรกในทิศทางนั้นจะกระตุ้นสัญญาณ


สัญญาณจะแสดงเป็นลูกศรด้านล่าง (ขาขึ้น) หรือด้านบน (ขาลง) ของแท่งสัญญาณ เมื่อเปิดแสดง TP/SL เส้นประจะแสดงระดับทำกำไรและหยุดขาดทุนจากแท่งเข้าซื้อขาย ป้าย TP หรือ SL จะระบุผลลัพธ์เมื่อระดับถูกแตะ


ป้าย SL Distance ที่เป็นทางเลือกจะแสดงแบบเรียลไทม์ว่าราคาปัจจุบันห่างจากขอบเขตโซนหยุดขาดทุนเท่าใด


--- การตั้งค่าและพารามิเตอร์หลัก ---


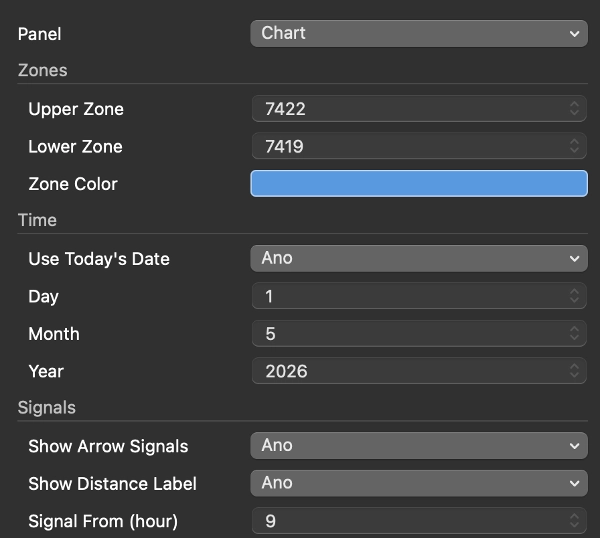
- โซน: ระดับราคาบนและล่าง, สีเส้น, แสดง/ซ่อน

- วันที่: ใช้วันที่วันนี้โดยอัตโนมัติหรือกำหนดวันที่เฉพาะด้วยตนเอง

- สัญญาณ: เปิดใช้งานลูกศร, กำหนดหน้าต่างเวลา (เช่น 15:30 / 23:00), การย้อนดูการทิ่ม (กี่แท่งหลังการทิ่มที่สัญญาณยังใช้ได้), ป้ายระยะทางเปิด/ปิด

- TP/SL: ทำกำไรเป็นจุด, แสดงเส้นและป้าย, ตารางผลลัพธ์เปิด/ปิด, โหมดซื้อขายเดี่ยว (เปิดการซื้อขายครั้งละหนึ่งรายการ), สีที่กำหนดเอง

- SL Distance: เปิดใช้งานป้าย, สีที่กำหนดเอง


--- กรณีการใช้งานและสถานการณ์ซื้อขายทั่วไป ---


ตัวบ่งชี้ออกแบบมาสำหรับการซื้อขายภายในวันของ US500 บนกราฟ 5 นาที กระบวนการทั่วไปคือ: ก่อนตลาดสหรัฐเปิด ผู้ซื้อขายตั้งระดับโซนบนและล่างสำหรับวันนั้น เมื่อหน้าต่างสัญญาณเปิด (ค่าเริ่มต้น 15:30 ปราก / 09:30 นิวยอร์ก) ตัวบ่งชี้จะตรวจสอบการตั้งค่ากรณี A, B หรือ C และทำเครื่องหมายจุดเข้าที่ถูกต้องด้วยลูกศร ตัวติดตาม TP/SL จะบันทึกผลลัพธ์โดยอัตโนมัติในช่วงเซสชัน


--- ตัวบ่งชี้นี้เหมาะสำหรับใคร ---


ผู้ซื้อขายระดับกลางถึงสูงที่มีวิธีการภายในวันที่กำหนดไว้แล้วและใช้โซนราคาคงที่เป็นส่วนหนึ่งของกระบวนการตัดสินใจ ตัวบ่งชี้นี้ไม่สร้างโซนอัตโนมัติ - ผู้ซื้อขายต้องระบุและป้อนระดับด้วยตนเองทุกวัน ไม่เหมาะสำหรับผู้เริ่มต้นที่ต้องการระบบสัญญาณอัตโนมัติเต็มรูปแบบ


--- ข้อจำกัดและหมายเหตุการใช้งานที่สำคัญ ---


- ต้องป้อนระดับโซนด้วยตนเองทุกวันซื้อขาย - ตัวบ่งชี้ไม่คำนวณโดยอัตโนมัติ

- ออกแบบและทดสอบสำหรับ US500 บนกราฟ 5 นาที พฤติกรรมบนเครื่องมือหรือกรอบเวลาที่ต่างกันไม่รับประกัน

- สถิติสัญญาณในอดีตที่แสดงในตารางผลลัพธ์เป็นเพียงข้อมูลอ้างอิงเท่านั้นและไม่รับประกันผลการดำเนินงานในอนาคต

- หน้าต่างเวลาสัญญาณใช้เวลาปราก (CET/CEST) ภายใน ปรับการตั้งค่าชั่วโมงจาก/ถึง หากโบรกเกอร์ของคุณใช้เวลาของเซิร์ฟเวอร์ที่ต่างกัน


สรุป

AI summary
G.A.S - Smart Entry Zone US 500 is a price action indicator designed for intraday trading of the US500 (S&P 500 CFD) on a 5-minute chart. It helps traders identify high-probability entry points within a manually defined price zone, marked by two horizontal levels representing the upper and lower boundaries of the Smart Entry Zone. The indicator analyzes price behavior around these levels on a bar-by-bar basis, detecting three types of signals (Case A, B, and C) based on price wicks, closes, and retests relative to the zone.

Signals appear as arrows indicating bullish or bearish entries, with optional automatic tracking and display of take profit (TP) and stop loss (SL) levels, including real-time SL distance labels. Users can customize zone levels, signal time windows, TP/SL parameters, and visual elements. The indicator logs trade statistics throughout the session for performance reference.

Intended for intermediate to advanced traders who incorporate fixed price zones into their intraday strategies, it requires manual input of zone levels daily and is specifically tailored for the US500 instrument. The indicator does not generate zones automatically and is not designed for other instruments or timeframes. Time settings use Prague time internally and should be adjusted if needed.
โปรไฟล์อินดิเคเตอร์
หมวดหมู่อินดิเคเตอร์
แนวรับและแนวต้าน
ประเภทเอาต์พุต
สัญญาณ
ข้อกำหนดด้านข้อมูล
แท่งเท่านั้น
สัญญาณที่รองรับ
แตะ Level ที่ระบุ

รีวิวจากลูกค้า

0.0
รีวิว: 0
รีวิวจากลูกค้า
ยังไม่มีรีวิวสำหรับผลิตภัณฑ์นี้ หากเคยลองแล้ว ขอเชิญมาเป็นคนแรกที่บอกคนอื่น!

การสนทนา

คำถามที่พบบ่อย

Key Levels
Supply & Demand
Support & Resistance
ผลิตภัณฑ์ที่มีให้บริการผ่าน cTrader Store รวมถึงบอทการเทรด อินดิเคเตอร์ และปลั๊กอิน มีให้บริการโดยนักพัฒนาบุคคลที่สามและมีไว้เพื่อวัตถุประสงค์ในการเข้าถึงข้อมูลและทางเทคนิคเท่านั้น cTrader Store ไม่ใช่โบรกเกอร์และไม่ได้ให้คำแนะนำการลงทุน คำแนะนำส่วนบุคคล หรือการรับประกันผลการดำเนินงานในอนาคต

นอกจากนี้คุณยังอาจชอบ

"Session Open Lines and Bar Counter" โลโก้
เรตติ้งสูง
4.8
(5)
อินดิเคเตอร์
Forex
BTCUSD
+5
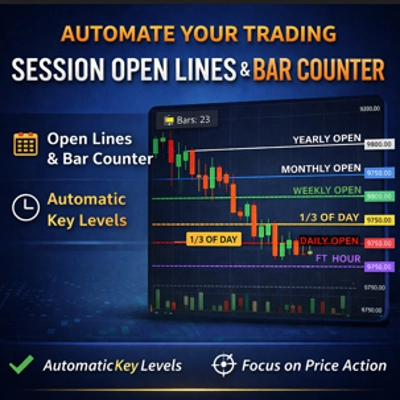
Auto-plots Open, High, and Low of Day/Week/Month/Year. Session candle counter + Round Numbers. Fully customizable
อินดิเคเตอร์
ATR
RSI
+5
Fusion trend line with a layered cloud, BULL and BEAR labels, scored re-entry triangles and exit markers.
อินดิเคเตอร์
RSI
SMC
+17
The Dominator SMC Base, Smart Money Concept Indicator.
อินดิเคเตอร์
SMC
Forex
+15
Session-based range tool projecting adaptive Gann & Fib levels with auto bias flip and extensions.
"PivotLevels" โลโก้
เรตติ้งสูง
4.7
(4)
อินดิเคเตอร์
Prop
Forex
+4
It draws Pivot Levels on the chart.
อินดิเคเตอร์
Key Levels
Chart UI Tools
+2
Visualize five major market sessions in GMT with editable times, high-low boxes and directional range lines.
อินดิเคเตอร์
ATR
EMA
+3
EMA cross filtered by a trend average and its ATR channel, with long, short and close marks and colored candles.
อินดิเคเตอร์
ATR
MSS
+5
Detects ICT Turtle Soup setups — liquidity sweeps with MSS confirmation, ATR filter & kill zone session filter.
"Delta-RSI Candle Pro" โลโก้
ยอดนิยม
4.6
(3)
อินดิเคเตอร์
ATR
RSI
+5
Delta RSI Candle Pro, the indicator that transforms ordinary candlesticks into powerful momentum visualizers.
"SupertrendChannels" โลโก้
เรตติ้งสูง
4.7
(4)
อินดิเคเตอร์
Supertrend-based channel for entries, trailing stops, and dynamic support/resistance zones.
อินดิเคเตอร์
EMA
Volume
+4
Advanced volume‑profile tool with delta, HVN/LVN zones, and precise POC‑based trade signals.
อินดิเคเตอร์
EMA
Supertrend
+4
Dynamic dual MA cloud indicator. Identifies trends, crossovers, and pullback entries in real time for any asset.
"Bubble Indicator 2.0" โลโก้
ยอดนิยม
4.3
(3)
อินดิเคเตอร์
SMC
Breakout
+1
Delta Peak Bubbles is a tick‑chart overlay for cTrader that highlights the strongest momentum spikes.
อินดิเคเตอร์
RSI
Signal
+1
Multi-timeframe version of the Quantitative Qualitative Estimation (QQE) indicator.
"Momentum Fair Value Gap" โลโก้
เรตติ้งสูง
4.5
(4)
อินดิเคเตอร์
RSI
EURUSD
+2
It identifies areas of market imbalance (Fair Value Gaps or FVGs) and projects them on the chart in a smart way
อินดิเคเตอร์
MSS
Volume
+3
Rejection-based volume profile with tiered heat zones, POC levels and a fully draggable anchor on cTrader.
อินดิเคเตอร์
Advanced customizable volume-profile indicator with buy/sell levels, delta analysis, multi-TF support and vivid gradient
อินดิเคเตอร์
RSI
RSI on the main chart with 45/55 momentum levels, overbought/oversold levels, averaged RSI, and multi-timeframe support.

ราคา

ตั้งแต่ 29/01/2026
140
ติดตั้งฟรี