
E7 BlackScholes Model
Indicador
252 transferências
Versão 1.0, Feb 2025
Windows, Mac
5.0
Avaliações: 1
Descrição
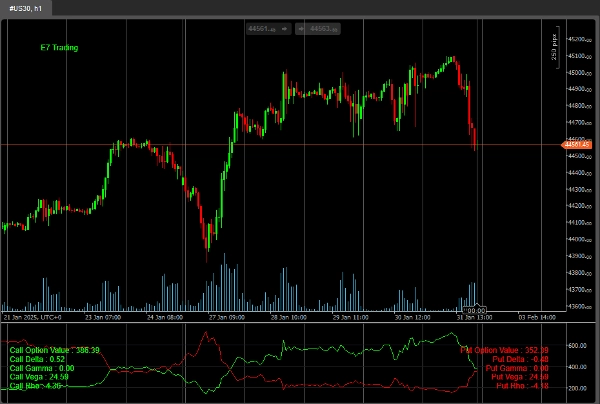
Este é um exemplo muito simples de uso do pacote ‘Math.Numerics’ dentro do cTrader para calcular o preço de Opções usando o modelo BlackScholes.
Versões futuras incluirão implementações mais sofisticadas.
Isto deve ser usado apenas para índices por enquanto, obrigado.
Boa sorte!
Resumo
Resumo de IA
E7 BlackScholes Model is an indicator designed for use within the cTrader platform that calculates option pricing based on the Black-Scholes model. It utilizes the Math.Numerics package to perform these calculations. Currently, the tool is intended primarily for indices such as NASDAQ, S&P 500, DAX, and Dow. The product offers a straightforward implementation of the Black-Scholes formula, with plans for more advanced versions in the future. This indicator assists traders in evaluating option prices on index markets by providing mathematical option valuation directly integrated into their trading environment.
Perfil do indicador
Avaliações de clientes
5.0
Avaliações: 1
5 | 100 % | |
4 | 0 % | |
3 | 0 % | |
2 | 0 % | |
1 | 0 % |
Avaliações de clientes
August 18, 2025
Pros: Calculates Black–Scholes theoretical option price and Greeks (Delta, Gamma, Theta, Vega) in real‑time. Lightweight and intuitive interface. Great for risk management and option analysis. Cons: No alerts or tooltips. Lacks template saving and real‑price comparison. Assumes constant volatility
Conversa
Perguntas frequentes
Indices
Os produtos disponíveis através da cTrader Store, incluindo bots de negociação, indicadores e plugins, são fornecidos por programadores terceiros e são disponibilizados apenas para fins informativos e de acesso técnico. A cTrader Store não é um corretor e não fornece aconselhamento em matéria de investimento, recomendações pessoais ou qualquer garantia de desempenho no futuro.
Mais deste autor


Preço
Desde 18/12/2024
2
Vendas
4.25K
Instalações gratuitas