Descrição
Um indicador limpo, simples e altamente visual que detecta cruzamentos entre duas Médias Móveis Simples (SMA) e exibe tudo claramente no gráfico.
Principais Características:
- Grandes setas coloridas exatamente no ponto de cruzamento → Verde Limão ↑ → Cruzamento de alta (compra potencial) → Vermelho ↓ → Cruzamento de baixa (venda potencial)
- Painel de status permanente no canto superior direito do gráfico → Tipo do último cruzamento (ALTA / BAIXA / AGUARDANDO) → Data e hora exatas do cruzamento → Períodos configurados das médias móveis
- 100% sem repintura
- Evita sinais duplicados na mesma barra
- Imprime mensagens no log cada vez que ocorre um cruzamento (ótimo para acompanhamento)
- Muito leve – funciona perfeitamente em qualquer timeframe
Minha forma favorita de usar (e a que recomendo):
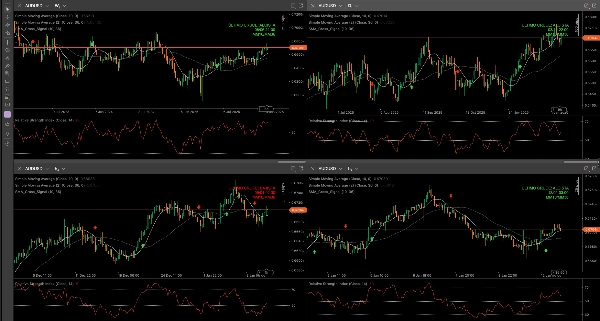
Eu aplico simultaneamente nos Weekly, Daily, H4 e H1 timeframes do mesmo par de moedas.
Eu principalmente faço entradas no H1, mas ter o indicador nos timeframes superiores me dá uma visão geral muito poderosa da direção dominante do par:
- Os cruzamentos de alta/baixa estão alinhados entre Weekly e Daily? → Maior probabilidade
- Sinais conflitantes entre timeframes? → Melhor esperar ou reduzir o tamanho da posição
Configurações populares que funcionam bem:
- 9 / 21
- 10 / 30
- 21 / 50
- 50 / 200 (especialmente útil nos gráficos Weekly e Daily)
Perfeito tanto para iniciantes (graças aos seus visuais claros e simplicidade) quanto para traders experientes que procuram uma base limpa para combinar com Price Action, suporte/resistência ou volume.
Completamente gratuito para toda a comunidade cTrader!
Experimente no demo, aplique no modo multi-timeframe e, se gostar… fique à vontade para deixar um comentário com suas configurações favoritas ou o par onde está funcionando melhor para você 😊
Boas negociações a todos!
Resumo
Key features include non-repainting signals, prevention of duplicate alerts on the same bar, and log messages for each crossover event. The indicator is lightweight and compatible with any timeframe, making it suitable for multi-timeframe analysis. Commonly used SMA period pairs include 9/21, 10/30, 21/50, and 50/200, with the latter especially useful on weekly and daily charts.
Traders often apply the indicator simultaneously on weekly, daily, 4-hour, and 1-hour timeframes to gain a comprehensive view of market direction and improve entry timing. It supports various markets including Forex and popular symbols like EURUSD, GBPUSD, USDJPY, XAUUSD, and BTCUSD. The indicator is designed for both beginners and experienced traders seeking clear, straightforward moving average crossover signals.