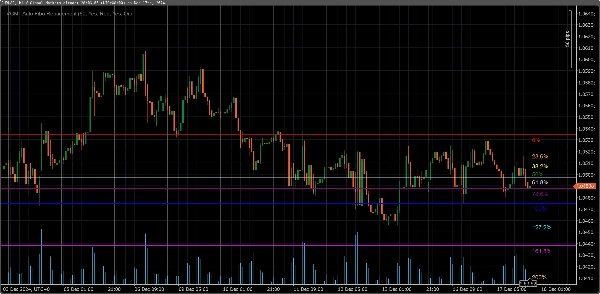
VGM - Auto Fibo Retracement
Logótipo de "VGM - Auto Fibo Retracement"
4.5
03/09/2025
824
Desktop
Desde 17/12/2024
Instalações gratuitas
824
Imagem carregada de "VGM - Auto Fibo Retracement"

This Auto Fibonacci Retracement Indicator automatically calculates and draws Fibonacci retracement levels on the chart based on the highest high and lowest low within a customizable lookback period. Users can configure colors and enable/disable specific Fibonacci levels, including popular extensions above 100% such as 127.2%, 161.8%, 200%, and 261.8%.

Key Features:
1. **Automatic Swing Detection**: Detects swing highs and lows dynamically within the chosen lookback period.
2. **Customizable Levels**: Enable/disable specific Fibonacci levels as per preference.
3. **Color Settings**: Choose individual colors for each level for better visual distinction.
4. **Extended Levels**: Includes commonly used extensions (127.2%, 161.8%, 200%, and 261.8%) for trend continuation analysis.
5. **Real-Time Updates**: Levels automatically adjust to changes in market conditions.

Ideal For:
- Traders using Fibonacci retracement and extensions for entry/exit levels.
- Users who need a clean, flexible, and automated Fibonacci tool.


Build by VantoFX. https://vantofx.com Free for all.

4.5
Avaliações: 2
5
50 %
4
50 %
3
0 %
2
0 %
1
0 %
Avaliações de clientes
August 10, 2025
This is helpful my friend, thanks for the upload :)
July 9, 2025
Pros: Automatically detects swing points and plots Fibonacci retracement levels. Easy to use, customizable, works across timeframes. Cons: No tooltips or alerts. Lacks template saving and historical swing tracking. Requires additional confirmation tools for reliable trading.
Também poderá gostar de
Tradingview Economic Calendar onn Chart
Customizable window inside your platform, access to any website Calendar
Vishal Volume Profile v2.0
Volume Profile plots traded volume at each price level, highlighting high activity zones of precise support & resistance
TrendStrengthSignals
Edge-aware clouds + Pro HUD: better entries, calmer exits, adaptive risk.
Bem avaliado
Grátis
BarSentiments
This Indicator is a technical analysis tool that measures the strength and direction of market sentiment
Buy and sell indicator
Buy and Sell Signals
Weekly Daily Levels
The Weekly Daily Levels indicator shows the OHLC, and mid-point prices for the previous day and week.
Flex VWAP
Flexible VWAP indicator with timezone-aware, custom time periods and automatic DST handling.
Indicador
NAS100
NZDUSD
Martingale
+26
ICT Killzones
ICT Killzones plots Asian, London & New York trading sessions on your cTrader charts with clear zones & labels.
Indicador
Signal
FractalArrowBuySell
Fractal Arrow Buy and Sell Indicator
Indicador
RSI
EURUSD
MACD
Supply&Demand
Precision Supply & Demand zones indicator—automatically plots key buy/sell areas on your chart for smarter entries.
Supply Demand Premium V2_NSC
The long awaited new and improved Supply Demand Premium V2 indicator. Unlock greater trading opportunities now!
LT Flexible Volume Profile
Flexible Volume Profile, designed with performance in mind.
Indicador
Indices
Stocks
Forex
+4
MACD Pro Trader
🚀 MACD Pro Trader – Advanced MACD with buy/sell signals, custom MAs & color-coded histograms for smarter trading! 📈🔥
Indicador
RSI
XAUUSD
Breakout
+4
Multi-Level Candle Bias Tracker
Price direction by calculating the probability of reaching new highs/lows. Shows levels & stats📈
Indicador
Indices
Forex
Signal
+2
US Dollar Index
US Dollar Index
Bem avaliado
Logótipo de "STC"
5.0
(2)
Grátis
STC
Schaff Trend Cycle (STC) Indicator
Blocks Liquidity MGC
BlocksLiquidity Indicator Analysis!
EURUSD Breakout Indicator
Breakout Multi-Timeframe Strategy Indicator