
Descrição
Indicadores da loja Pinescriptlabs: 🤖Pinescriptlabs Store cBots : (cBot)
Gold & BTC BreakoutSession Pivots(novo)
SmartTrend Support &
Resistance
Lines
Dynamic
Market Structure
Analysis
of
Turning Points
Fibonacci
Linear
Regression
Multi-timeframe
Multi-Level
Candle Bias
Tracker
Auto
Support and
Resistance
Trend
Lines
All
Support and
Resistance
Levels
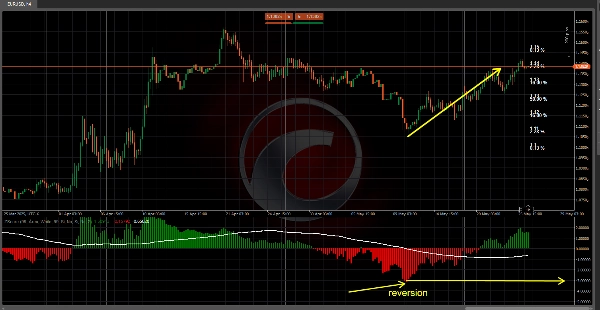
O Z-Score transforma o preço em uma "escala de
desvio padrão",
mostrando o quão longe o fechamento de cada vela (ou abertura, máxima, mínima) se desvia da sua
média histórica. Com uma visualização intuitiva, ajuda a identificar condições de sobrecompra/sobrevenda
e zonas de reversão de alta probabilidade! 🔄
1️⃣ O que ele faz?
🔹 Padroniza o preço: Converte o valor absoluto de fechamento em um Z-Score—quantos desvios padrão está da média
dos últimos N barras.
🔹 Destaca
Extremos estatísticos: Valores
próximos a ±1, ±2, ou ±3 indicam raridade no movimento do preço:
- ±1 DP (≈ 68% de probabilidade entre –1 e 1)
- ±2 DP (≈ 95% de probabilidade entre –2 e 2)
- ±3 DP (≈ 99,7% de probabilidade entre –3 e 3)
🔹 Auxilia
no trading de reversão à média:
Quando o Z-Score ultrapassa ±2 ou ±3, o mercado está em uma zona extrema
e tende a
reverter para a média (zero).
🔹 Visualização
clara: Usando histogramas (ou velas especiais), uma linha de média móvel e zonas coloridas, você pode ver instantaneamente se o preço está se comportando "normalmente" ou é um outlier estatístico
.
2️⃣ Como funciona?
📐 Cálculo da Média e Desvio Padrão
- Um
período de retrocesso (ex: 99
barras) é usado. - A média e o desvio padrão (DP)
dos preços de fechamento são calculados. - DP maior = mais volatilidade nos movimentos de preço.
🧮 Fórmula do Z-Score
Z=Fechamento Atual−Média HistóricaDesvio PadrãoZ=Desvio PadrãoFechamento Atual−Média Histórica
- Z positivo → Fechamento acima da média.
- Z negativo → Fechamento abaixo da média.
📊 Probabilidades da Tabela Z
- Destaca a
coluna do Z-Score atual para mostrar quão raro/extremo é o preço!
3️⃣ Como usar no trading
✅ Reversão à média: Procure Z > +2 ou Z < –2 para negociar reversões (vender extremos sobrecomprados
, comprar extremos sobrevendidos).
✅ Confirmação de tendência: Um Z sustentado
> 0 + média móvel ascendente sinaliza
força; Z < 0 + média móvel descendente sugere fraqueza.
✅ Gestão de risco: Próximo a ±1 DP, espere movimentos normais; próximo a ±3
DP, ajuste stops e
tamanhos de posição cuidadosamente.
✅ Temporização de entrada: Combine Z-Scores extremos com níveis de suporte/resistência
para entradas precisas.
4️⃣ Prós e considerações
✔️ Vantagens
- Vantagem estatística na identificação de condições extremas de preço.
- Múltiplos modos de exibição (histograma, velas, bandas, tabela de probabilidade).
- Fácil personalização (comprimento, cores, tipo de gráfico).
⚠️ Considerações:
- Em tendências fortes
, o preço pode permanecer "extremo" por longos períodos sem reverter. - Pressupõe uma distribuição
normal—pode não funcionar bem em mercados altamente voláteis/distorcidos. - Melhor usado em ambientes de volatilidade estável.
Resumo
The indicator calculates the mean and standard deviation of recent closing prices to determine the Z-Score using the formula:
Z = (Current Close − Historical Mean) / Standard Deviation.
Positive Z-Scores indicate prices above the mean, while negative scores indicate prices below it.
ZScore Reversion provides clear visualizations through histograms, special candles, moving averages, and colored zones to distinguish normal price behavior from statistical outliers. It supports mean reversion trading by signaling when prices exceed ±2 or ±3 standard deviations, suggesting a likely return to the mean. It also aids trend confirmation by interpreting sustained positive or negative Z-Scores combined with moving average trends.
Risk management is facilitated by adjusting stops and position sizes near extreme Z-Score values. Entry timing can be refined by combining extreme Z-Scores with support and resistance levels. The indicator offers multiple display modes and customization options for length, colors, and chart types. It is best suited for stable volatility environments and assumes a normal distribution of price data.
Avaliações de clientes
5 | 100 % | |
4 | 0 % | |
3 | 0 % | |
2 | 0 % | |
1 | 0 % |


