
Descrição
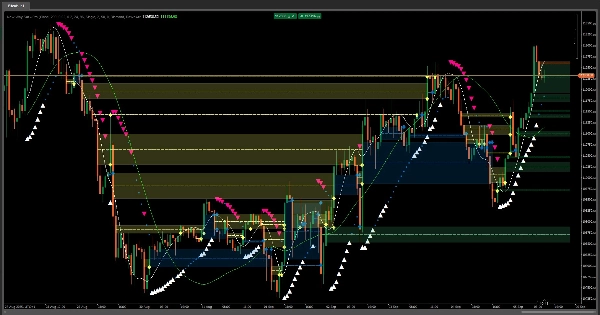
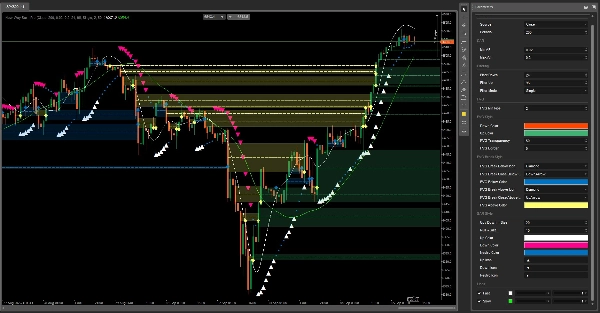
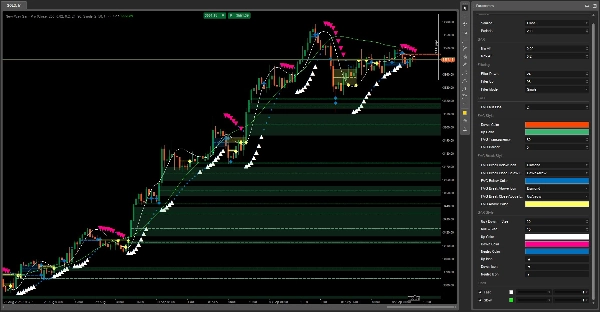
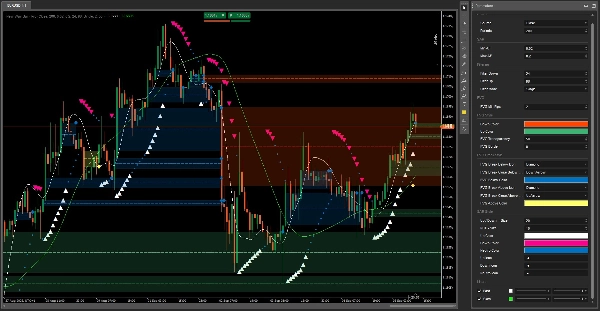
O Parabolic SAR, ou "Stop and Reverse", é uma ferramenta dinâmica de análise técnica que ajuda os traders a identificar potenciais reversões de tendência e a definir ordens de stop-loss móveis. Ao contrário dos indicadores tradicionais, o Parabolic SAR cria uma série de pontos que seguem o movimento do preço, ajustando-se conforme a tendência ganha impulso.
Nossa versão moderna oferece uma abordagem nova e intuitiva para este indicador clássico. Ao combinar sinais poderosos e confiáveis com um design limpo e moderno, ajuda os traders a visualizar facilmente a direção da tendência e os potenciais pontos de entrada ou saída. Ao integrar níveis-chave do mercado como Fair Value Gaps, esta versão fornece um sistema abrangente para tomar decisões de negociação mais precisas e confiantes, dando a você a clareza necessária para navegar nos mercados com confiança.
Resumo
Avaliações de clientes
5 | 50 % | |
4 | 50 % | |
3 | 0 % | |
2 | 0 % | |
1 | 0 % |


