
VolumeThermometer
Indicador
420 transferências
Versão 1.0, Aug 2025
Windows, Mac
Desde 26/05/2025
381M
Volume negociado
60.65K
Pips ganhos
14
Vendas
1.38K
Instalações gratuitas
Descrição
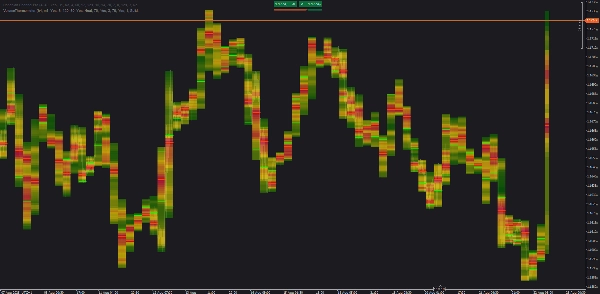
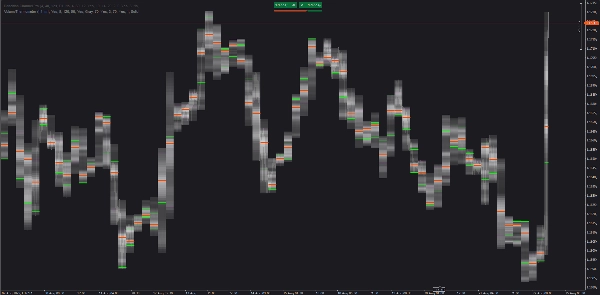
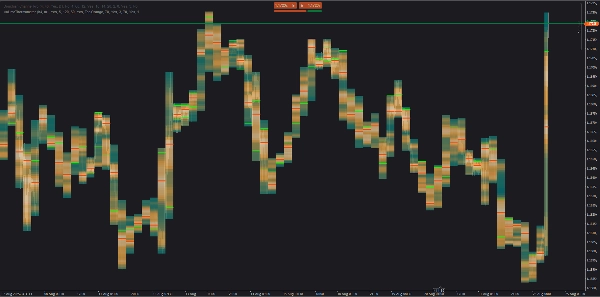
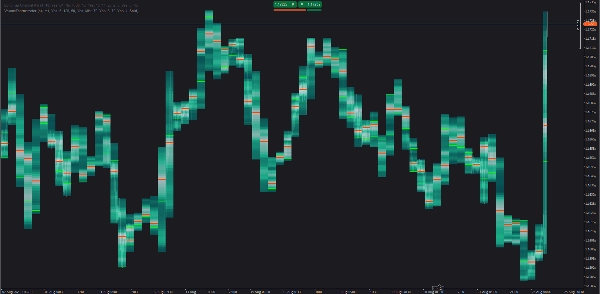
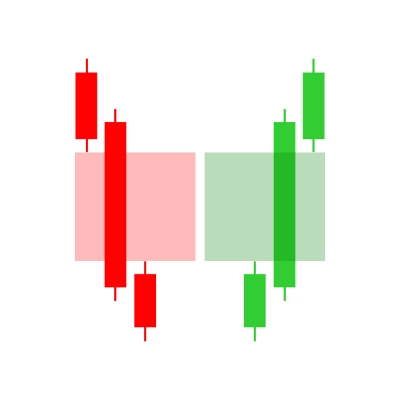
Um heatmap do cTrader que mostra como o volume é distribuído dentro de cada candle HTF. Ele usa barras LTF (por exemplo, M1) para construir bins verticais de volume, depois desenha POC e Value Area (VA) linhas. O candle HTF atual (inacabado) é pintado em tempo real.
Como funciona
- Agrega volume de ticks das barras LTF.
- Divide cada candle HTF em
Binsfatias de preço e atribui volume pela sobreposição de preço. - Colore os bins pelo volume relativo; desenha POC, linhas opcionais de VA, e pode estendê-las para a direita.
- Carrega automaticamente histórico antigo apenas para o intervalo visível (pequenos lotes).
Como usar
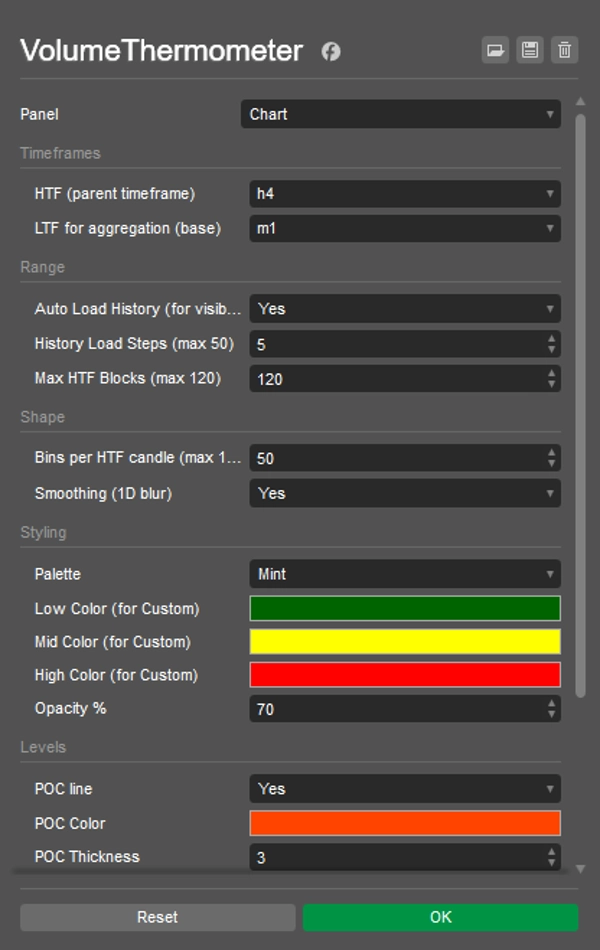
- Escolha HTF (por exemplo, H4) e LTF (por exemplo, M1).
- Ative Carregamento Automático do Histórico; role/zoom para o intervalo desejado.
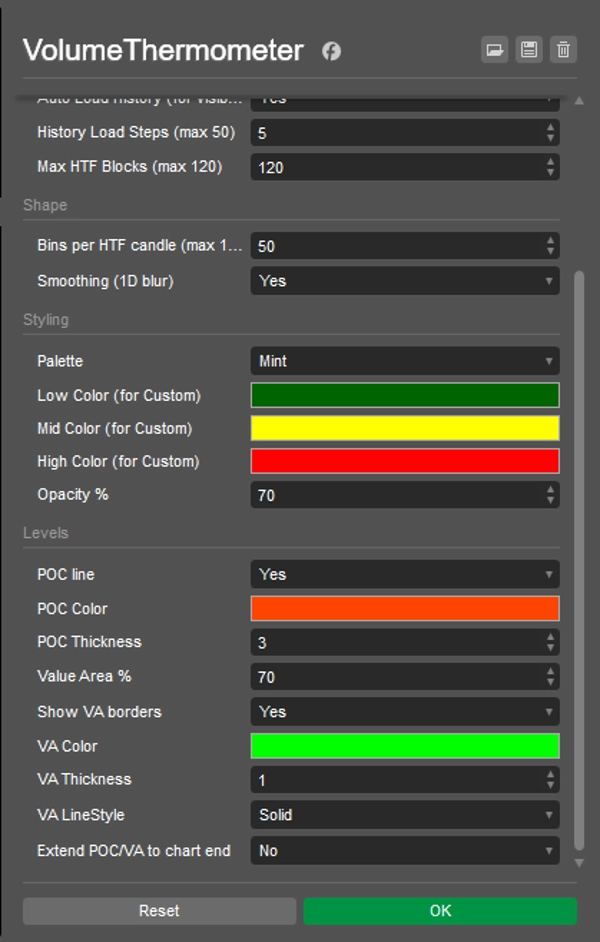
- Ajuste Bins (detalhe), Máximo de Blocos HTF (quantos candles mostrar), Suavização, Opacidade, e cores.
- Observe as reações do POC/VA e como o POC migra de candle em candle.
Ideias rápidas
- Reteste do POC: primeiro toque do POC anterior com confirmação LTF.
- Rotação do VA: reentrada no VA frequentemente mira a borda do POC/outro VA.
- Passagem pelo LVN: áreas finas (frias) tendem a se mover rapidamente para o próximo nó.
Notas
- Usa volume de ticks (bom proxy em FX/CFD, não volume de bolsa).
- Para desempenho, reduza Bins ou Máximo de Blocos HTF se necessário.
Resumo
Resumo de IA
VolumeThermometer is a cTrader indicator that visualizes intra-higher timeframe (HTF) volume distribution using a heatmap. It aggregates tick volume data from lower timeframe (LTF) bars (e.g., M1) to construct vertical volume bins within each HTF candle (e.g., H4). The indicator highlights the Point of Control (POC) and Value Area (VA) lines, showing where the most volume is concentrated by price level. The current HTF candle is updated in real time, and the indicator automatically loads historical data for the visible chart range in small batches to optimize performance.
Key features include:
- Aggregation of tick volume from LTF bars.
- Division of HTF candles into price bins with volume assigned by price overlap.
- Color-coded volume bins indicating relative volume intensity.
- Display of POC and optional VA lines, with the ability to extend these lines forward.
- Customizable settings for bin detail, maximum HTF candles displayed, smoothing, opacity, and colors.
- Supports multiple markets including Forex, indices, commodities, stocks, and cryptocurrencies such as BTCUSD and EURUSD.
Users can monitor POC retests, VA rotations, and low volume node pass-throughs to analyze volume behavior within HTF candles. The indicator uses tick volume as a proxy, suitable for FX and CFD markets.
Perfil do indicador
Avaliações de clientes
0.0
Avaliações: 0
Avaliações de clientes
Ainda não há avaliações para este produto. Já o experimentou? Seja o primeiro a contar a outras pessoas!
Conversa
Perguntas frequentes
BTCUSD
Prop
Forex
Indices
EURUSD
Commodities
Crypto
Stocks
NAS100
Os produtos disponíveis através da cTrader Store, incluindo bots de negociação, indicadores e plugins, são fornecidos por programadores terceiros e são disponibilizados apenas para fins informativos e de acesso técnico. A cTrader Store não é um corretor e não fornece aconselhamento em matéria de investimento, recomendações pessoais ou qualquer garantia de desempenho no futuro.


Preço
Desde 26/05/2025
381M
Volume negociado
60.65K
Pips ganhos
14
Vendas
1.38K
Instalações gratuitas