Beschreibung
Heikin Ashi Struktur-Bias (cTrader Indikator)
Automatische Angebots-Nachfrage-Zonen mit Multi-Timeframe-Bias.
Was es tut – in einfachem Deutsch
Dieser Indikator:
- Liest die Heikin Ashi Kursbewegung und erkennt bedeutende Pivot-Verschiebungen.
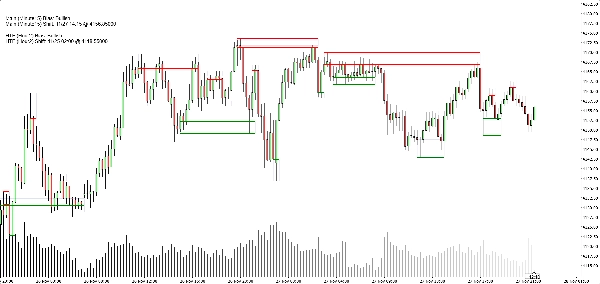
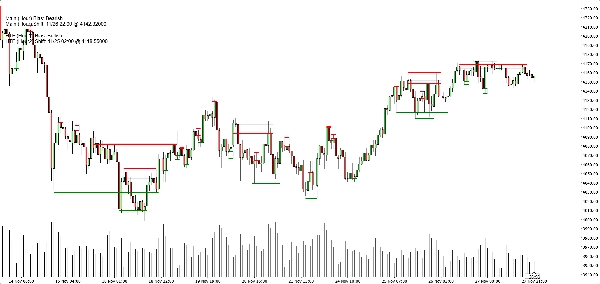
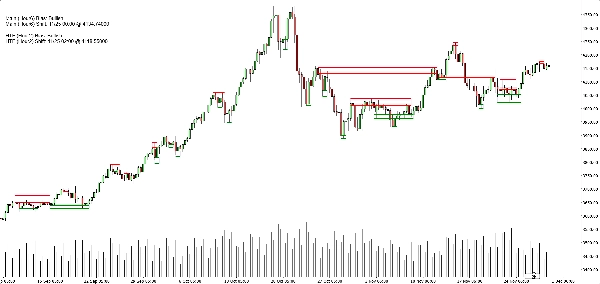
- Erstellt dynamische Unterstützungs- und Widerstandszonen um diese Pivot-Punkte herum, unter Verwendung sowohl des Docht-Extremes als auch des Kerzenkörpers (nicht nur zufällige Linien).
- Fasst nahegelegene Zonen intelligent zusammen, sodass Sie klare, handelbare Niveaus sehen, anstatt eines Waldes von horizontalen Linien.
- Erzeugt eine klare bullische oder bärische Tendenz, wann immer der Kurs die letzte Unterstützungs- oder Widerstandszone vollständig durchbricht.
- Zeigt Ihnen die Tendenz für:
-
- Ihren Chart-Zeitrahmen, und
- Einen optionalen höheren Zeitrahmen (Standard H2) — ohne HTF-Unordnung auf Ihrem Chart zu zeichnen.
Ergebnis: Ein Blick sagt Ihnen wo die echten Niveaus sind und ob der Markt gerade nach oben oder unten tendiert.
Das Problem, das es löst
Die meisten Trader haben dieselben Probleme:
- Von Hand gezeichnete Unterstützungs-/Widerstandslinien sind:
-
- subjektiv,
- inkonsistent,
- und oft übertrieben.
- Einfache „Zickzack + horizontale Linie“-Indikatoren:
-
- behandeln die Zonengröße nicht richtig,
- stapeln Niveaus übereinander,
- oder verlängern Zonen so weit, dass sie die Hälfte des Charts abdecken.
- Der Bias ist oft „im Kopf“ – nicht etwas, das man klar sehen oder regelbasiert nutzen kann.
Dieser Indikator ist gebaut, um:
- Die Heikin Ashi Struktur in klare, objektive Zonen zu verwandeln,
- Ihnen einen regelbasierten Trend/Bias basierend auf diesen Zonen zu geben,
- Während der Chart sauber und lesbar bleibt.
Wie die Zonen gebaut werden (traderfreundliche Erklärung)
Für jeden Heikin Ashi Pivot betrachtet der Indikator eine 3-Kerzen-Struktur:
- Wenn HA von rot zu grün wechselt, markiert es einen Unterstützungspivot.
- Wenn HA von grün zu rot wechselt, markiert es einen Widerstandspivot.
Dann baut es die Zone:
Unterstützungszonen
- Findet den niedrigsten Docht unter den 3 Kerzen (echtes Extrem).
- Findet das nächstniedrigste Tief, das immer noch höher als dieses Extrem ist.
- Verwendet den Kerzenkörper (Open/Close) nahe diesem inneren Tief, um die „handelbare“ Seite der Zone zu definieren.
- Endgültige Unterstützungszone:
-
- Unten = extrem niedriger Docht,
- Oben = körperbasiertes inneres Niveau.
Widerstandszonen
- Findet den höchsten Docht unter den 3 Kerzen.
- Findet das nächsthöchste Hoch, das immer noch niedriger als dieses Extrem ist.
- Verwendet den Körper nahe diesem inneren Hoch.
- Endgültige Widerstandszone:
-
- Oben = extrem hoher Docht,
- Unten = körperbasiertes inneres Niveau.
Jede Zone ist also nicht nur ein willkürlicher Bereich:
Es ist ein Docht-zu-Körper-Bereich, der darstellt, wo der Kurs wirklich abgelehnt oder umgekehrt hat.
Zusammenführungslogik (warum der Chart sauber bleibt)
Zonen desselben Typs (Unterstützung mit Unterstützung, Widerstand mit Widerstand):
- Werden als Einheiten auf einer Zeitachse behandelt.
- Können nur zusammengeführt werden, wenn sie tatsächlich im Preis überlappen.
- Das Zusammenführen ist strikt lokal:
-
- Eine neue Zone kann sich mit:
-
- der jüngsten Zone (direkt nebeneinander), oder
- der zweitjüngsten Zone (+1 Abstand), und
- einer zusätzlichen „Anker“-Zusammenführung dahinter, wenn die neue kombinierte Zone jetzt die vorherige Struktur überlappt.
Das hält das Verhalten intuitiv:
- Zonen „verschlingen“ nicht die gesamte Historie.
- Ältere Niveaus werden respektiert, dürfen aber keine riesigen Mega-Zonen erzeugen.
- Lokale Strukturen wie A–B–C oder A–C+D werden kontrolliert behandelt.
Bias-Logik (wie Sie tatsächlich damit handeln)
Für jeden Zeitrahmen (Haupt- und HTF):
- Verfolgt der Indikator die jüngste zusammengeführte Unterstützungszone und die jüngste zusammengeführte Widerstandszone.
- Dann, bei jeder geschlossenen Kerze:
-
- Wenn der Kurs über der jüngsten Widerstandszone schließt → wird der Bias bullisch.
- Wenn der Kurs unter der jüngsten Unterstützungszone schließt → wird der Bias bärisch.
Es speichert:
- Die Zeit der letzten Bias-Umkehr,
- Das Preisniveau, bei dem der Kurs die Zone durchbrochen hat.
Im Chart zeigt ein kleines Textfeld:
Haupt (H1) Bias: BullischHaupt (H1) Wechsel: 26.11. 15:00 @1.08750
Wenn HTF aktiviert ist, sehen Sie auch etwas wie:
HTF (H2) Bias: BärischHTF (H2) Wechsel: 25.11. 08:00 @1.09200
Sie können auch eine Sound-Benachrichtigung aktivieren, wenn der Bias des Hauptzeitrahmens wechselt.
Was Sie im Chart sehen
- Unterstützungszonen:
-
- Grüne horizontale Basis-/Triggerlinien (optional),
- Ein weiches marineblaues Rechteck (sehr geringe Deckkraft), das das gesamte Unterstützungsband zeigt.
- Widerstandszonen:
-
- Rote Linien + weiches marineblaues Rechteck für das Band.
- Saubere Anzeige-Umschalter:
-
- Unterstützungszonen ein-/ausblenden,
- Widerstandszonen ein-/ausblenden,
- Gefüllte Rechtecke ein-/ausschalten,
- Basis-/Triggerlinien ein-/ausschalten,
- Bias-Panel ein-/ausschalten.
Das ermöglicht verschiedenen Tradern die Wahl zwischen:
- Einem eher minimalistischen Look (vielleicht nur Rechtecke), oder
- Einer eher präzisen Ansicht (exakte Linien sichtbar).
Typische Anwendungsfälle
Sie können ihn als nützlich positionieren für:
- Trendfilterung
-
- Nur nach Käufen suchen, wenn sowohl Haupt-TF als auch HTF Bias bullisch sind.
- Nur nach Verkäufen suchen, wenn beide bärisch sind.
- Zoneneinstiege
-
- Verwenden Sie die Zonen als Interessensgebiete für:
-
- Limit-Orders,
- Bestätigungseinstiege (z.B. Kurs kehrt zu einer gebrochenen Zone zurück und lehnt erneut ab),
- Stop-Setzung knapp außerhalb des äußeren Bandes.
- Top-Down-Analyse
-
- HTF-Bias (standardmäßig H2) als Gesamtbild,
- Chart-TF-Bias für Timing,
- Zonen für konkrete Ausführungsebenen.
Was es NICHT ist (wichtig für ehrlichen Verkauf)
- Es ist kein Roboter, der automatisch für Sie handelt.
- Es ist kein „heiliger Gral“-Signal, das Gewinn garantiert.
- Es ist eine Struktur- und Bias-Engine:
-
- Definiert Zonen objektiv,
- Definiert Trend/Bias objektiv basierend auf diesen Zonen,
- Überlässt das eigentliche Trade-Management dem Trader/der Strategie.
Zusammenfassung
It provides a rule-based bullish or bearish bias by tracking price breaks above resistance or below support zones on both the current chart timeframe and an optional higher timeframe. This bias is displayed on a built-in dashboard panel, with optional sound alerts for bias changes.
The indicator works across all timeframes and markets where price forms swings, including forex, crypto, stocks, and futures. It features customizable lookback periods, automatic cleanup of old zones, and toggles for display elements to suit different trader preferences.
Typical uses include trend filtering by aligning biases across timeframes, identifying zone entries for limit or confirmation orders, and supporting top-down analysis. The tool timestamps and sequences pivots and bias shifts, facilitating automation or journaling. It is a structure and bias engine that aids traders in objectively defining market levels and trends while maintaining chart clarity.
Kundenbewertungen
5 | 33 % | |
4 | 67 % | |
3 | 0 % | |
2 | 0 % | |
1 | 0 % |