
CandleColourFlow_MultiFx
インジケーター
2 購入済
バージョン 1.0、Jul 2025
Windows、Mac
4.0
レビュー: 2
説明
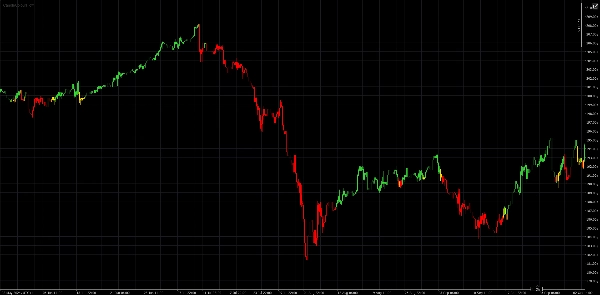
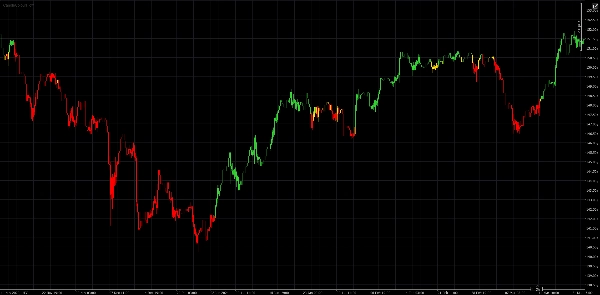
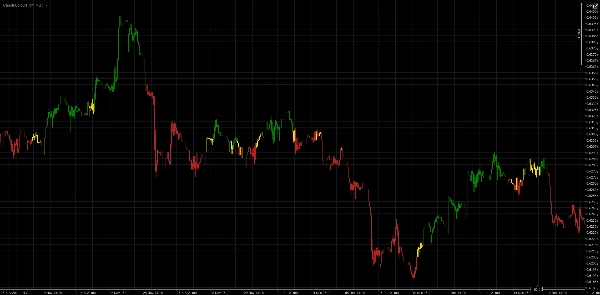
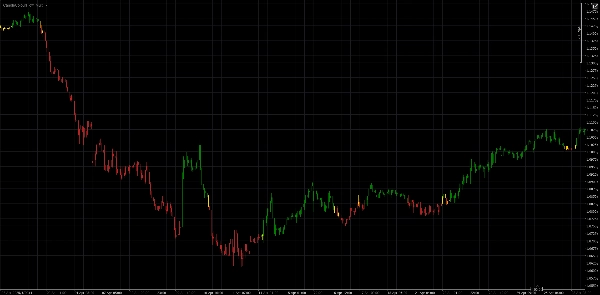
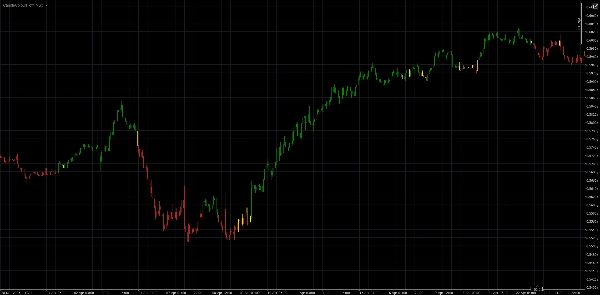
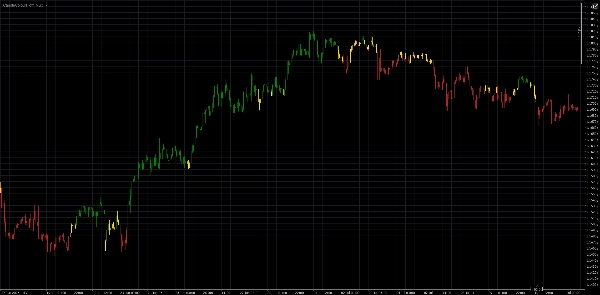
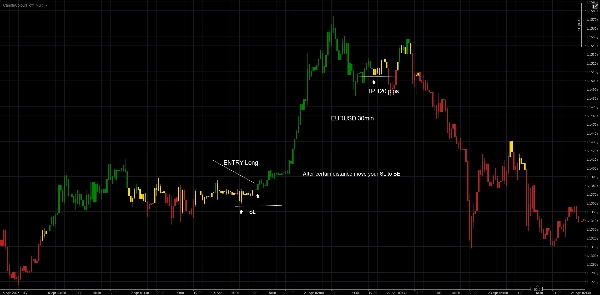
CandleColourFlow は、外国為替市場のトレンドや市場の転換点を明確かつ迅速に識別するために設計された革新的なインジケーターです。そのシンプルで直感的なカラ―システムにより、初心者のトレーダーでもより情報に基づいた取引判断が可能になります。
🔹 緑のローソク足 – ロングポジションを開くのに好ましい状況を示唆します
🔹 赤のローソク足 – ショート取引の可能性を示唆します
🔹 金色のローソク足 – 市場の迷いを示し、統合またはトレンドの継続の可能性があります
💡 CandleColourFlow の独自性は何ですか?
- 複数のインジケーターを必要とせず、市場状況を明確に視覚的に把握できる
- モメンタムの変化や価格構造の変化を自動検出
- 市場全体の状態を迅速に評価するのに最適
- すべての時間枠で機能しますが、私の意見では1時間以上が最適ですが、好みによります
⚠️ 法的免責事項:
このインジケーターは教育目的のみを意図しています。投資アドバイスや金融取引の実行推奨を構成するものではありません。
もっと知りたいですか?
CandleColourFlow の追加バージョンがまもなく登場します。それぞれ独自の機能とより広範な市場サポートを備えています。
概要
AIによる概要
CandleColourFlow_MultiFx is a Forex market indicator designed to identify trends and potential turning points using a straightforward color-coded system. It displays green candles to indicate favorable conditions for long positions, red candles to suggest potential short trade opportunities, and gold candles to signal market indecision, such as consolidation or possible trend continuation. The indicator provides clear visual insights into market conditions without requiring multiple tools, automatically detects momentum shifts and changes in price structure, and facilitates quick assessment of overall market state. It is optimized for use on Forex majors, minors, and crosses, and functions across all timeframes, with a preference for 1-hour and higher intervals. This tool is intended for educational purposes and does not constitute investment advice.
インジケーターのプロフィール
カスタマーレビュー
4.0
レビュー: 2
5 | 0 % | |
4 | 100 % | |
3 | 0 % | |
2 | 0 % | |
1 | 0 % |
カスタマーレビュー
July 25, 2025
ディスカッション
よくあるご質問
cTrader Storeで入手可能な取引ボット、インジケーター、プラグインなどの商品は、第三者の開発者が提供するものであり、情報と技術の取得のみを目的としてご利用いただけます。cTrader Storeはブローカーではなく、投資助言や個人的な推奨を行うことも、将来のパフォーマンスを保証することもありません。
この作成者の他の商品


価格
登録日 25/02/2025
2
販売
266
無料インストール