
SMC Liquidity Hunter
インジケーター
2 購入済
バージョン 1.0、Apr 2026
Windows、Mac
3.5
レビュー: 2
説明
indicator は、市場構造に基づいてリアルタイムでローソク足に色を付け、流動性ゾーン、機関投資家のフロー、および統合レンジを描画します。Smart Money Concepts(SMC)の原則に基づいて取引を行うトレーダー向けに設計されています。
🧠 アルゴリズムのロジック
https://chartshots.spotware.com/c/69f0e3fd81319
1. 市場構造の検出 🔍
- ピボット(局所的な高値と安値)を 設定可能な遡及期間を使用して検出します。
- 連続するピボットを比較し 構造を判断します:
-
- 高値更新+安値更新 = 強気バイアス 📈
- 高値切り下げ+安値切り下げ = 弱気バイアス 📉
- 混合シグナル = 中立バイアス ➡️
- ノイズをフィルター:ATR(平均真の範囲)に調整可能な感度を掛けた閾値を超えるピボットのみをカウントします。
https://chartshots.spotware.com/c/69f0e7e752b74
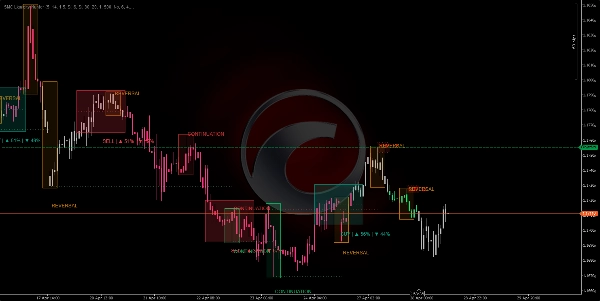
2. 機関投資家のフロー(フローボックス) 🔄
- 新しい重要なピボットが形成されるたびに、アルゴリズムは 前のピボットから新しいピボットまでの水平線を描画します。
- フローを分類します:
-
- 継続:価格がトレンドを尊重(上昇トレンドではHL、下降トレンドではLH) ✅
- 反転:価格が構造を破る(上昇トレンドではLL、下降トレンドではHH) ⚠️
- ピボットの周りに 色付きのボックス を描画し、ラベルは "CONTINUATION"または "REVERSAL"です。
3. 供給/需要ゾーン(流動性) 💧
https://chartshots.spotware.com/c/69f0e8e7aef29
- 各重要なピボットの周りに、将来に向けて設定可能なバー数分延長された 水平バンド が描かれます。
- これらのゾーンは 未執行の機関投資家の注文を表します:
-
- 弱気のピボット → SUPPLYゾーン (売り注文) 🔴
- 強気のピボット → DEMANDゾーン (買い注文) 🟢
- ゾーンは、価格が十分な力で貫通するか寿命が切れると 破壊され消失します。
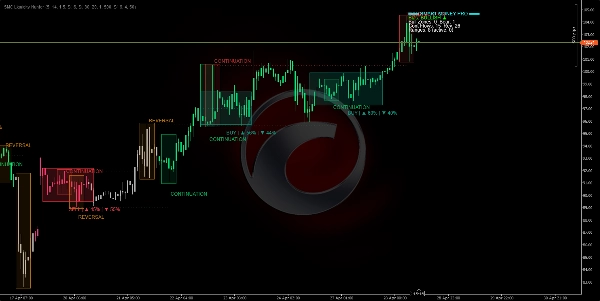
4. レンジ検出エンジン(統合) 📦
- 単純移動平均(SMA)と、その周りの ATRバンドを計算します。
- もし遡及ウィンドウ内の すべてのバーが バンド内に留まっていれば、アルゴリズムは 統合レンジを識別します。
- 以下を備えた 青い長方形を描画します:
-
- 点線の中央線(レンジの均衡) ⚖️
- ブレイクアウト確率のパーセンテージ 強気/弱気の基準:
-
- 方向性モメンタム(ADX/DI+ 対 DI-) 📐
- レンジ内の累積強気対弱気の出来高 📊
- 上半分対下半分での滞在時間 ⏱️
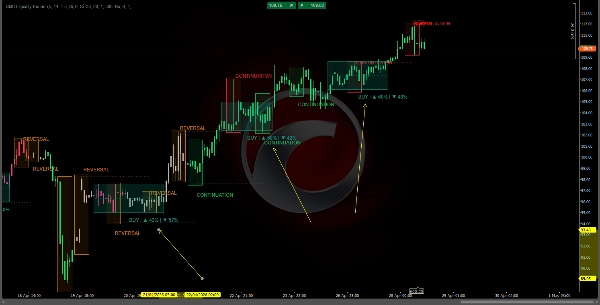
5. ローソク足の色付け(クリーンで視覚的) 🕯️
- 緑のローソク足 = 確認された強気構造(HH+HL) 🟢
- マゼンタ/赤のローソク足 = 確認された弱気構造(LH+LL) 🔴
- 灰色のローソク足 = 中立または移行段階 ⚪
- 重なりのない長方形:実際のヒゲと実体が常に完全に見えます。
📋 ダッシュボード(コーナー)
アクティブなゾーン、フロー、レンジの数値サマリー
🛠️ 使い方
⚙️ 推奨設定
- タイムフレーム:H1以上(Smart Moneyに最適)。
- デフォルトパラメータ:Forex、指数、暗号通貨に適しています。
- 感度の調整:変動の激しい市場では増加、乱高下する横ばい市場では減少させます。
📗 取引ルール :
✅ ロングエントリー(買い)
- ローソク足は 緑色 (強気バイアスが有効) 🟢
- 価格がアクティブな "DEMAND" ゾーンに接触または接近します 🟢
- そのゾーンに "CONTINUATION" ボックス("REVERSAL"ではない)が表示されます ✅
- ダッシュボードは アクティブレンジ(あれば)で強気のブレイクアウト確率が60%超 を示します 📊
✅ ショートエントリー(売り)
- ローソク足は マゼンタ/赤色 (弱気バイアスが有効) 🔴
- 価格がアクティブな "SUPPLY" ゾーンに接触または接近します 🔴
- そのゾーンに "CONTINUATION" ボックス("REVERSAL"ではない)が表示されます ✅
- ダッシュボードは 弱気のブレイクアウト確率が60%超 を示します 📊
❌ 以下の場合は取引しないでください...
- ローソク足が 灰色 (バイアス未定義) ⚪
- エントリー直前に "REVERSAL" シグナルが表示される場合 ⚠️
- 価格が 青いレンジ内 にあり、まだ明確なブレイクアウトがない場合 🔵
- ダッシュボードが 逆の合流 (強気セットアップでの弱気合流、またはその逆)を示す場合 🔄
📈 ダッシュボードの解釈
text
═══ SMART MONEY PRO ═══
バイアス:強気 ▲ ← 現在の市場バイアス
強気ゾーン:2 弱気:1 ← アクティブな流動性ゾーン
継続フロー:3 反転:0 ← 継続と反転の数
レンジ:4(アクティブ:1) ← 総レンジとアクティブレンジ
アクティブレンジ ▲65% ▼35% ← ブレイクアウト確率
⚡ 強気の合流 ← 最大の整合シグナル
💡 重要な原則
- ✅ リペイントなし:すべて閉じたバーのデータのみを使用して計算されます。
- ✅ クリーンなチャート:色付きの実際のローソク足、半透明のゾーン、視覚的な乱雑さなし。
- ✅ 構造のプレビュー:ローソク足の色がピボットが明確になる前の市場フェーズを示します。
- ✅ 組み込みの合流:アクティブゾーン+アクティブレンジ+フローシグナルがすべて整合すると、ダッシュボードが明示的にそれを示します。
概要
AIによる概要
SMC Liquidity Hunter is a trading indicator designed around Smart Money Concepts (SMC) principles. It analyzes market structure by identifying pivots (local highs and lows) and classifying trends as bullish, bearish, or neutral based on consecutive pivot comparisons. The indicator filters noise using an ATR-based threshold and colors candles in real-time to reflect market bias: green for bullish, magenta/red for bearish, and gray for neutral phases.
Key features include:
- **Institutional Flows:** Draws horizontal lines and colored boxes between significant pivots, labeling flows as "CONTINUATION" or "REVERSAL" to indicate trend respect or break.
- **Supply and Demand Zones:** Highlights unexecuted institutional orders with horizontal bands around pivots, distinguishing supply (sell) and demand (buy) zones that expire or break upon price penetration.
- **Range Detection:** Identifies consolidation ranges using an SMA with ATR bands, marking them with blue rectangles and providing breakout probability percentages based on momentum, volume, and time distribution.
- **Dashboard:** Displays numeric summaries of active zones, flows, ranges, and breakout probabilities, including confluence signals when multiple factors align.
Recommended for use on H1 or higher timeframes, the indicator suits Forex, indices, and cryptocurrencies. It operates without repainting by relying on closed bar data and maintains a clean chart presentation with visible candle wicks and bodies.
インジケーターのプロフィール
インジケーターのカテゴリー
市場構造(SMC)
出力の種類
ビジュアル表示
シグナル
データ要件
バーのみ
サポート対象のシグナル
ブレイクアウト
反転
トレンドの強さ
ラインタッチ
ラインブレイク
カスタマーレビュー
3.5
レビュー: 2
5 | 50 % | |
4 | 0 % | |
3 | 0 % | |
2 | 50 % | |
1 | 0 % |
カスタマーレビュー
July 23, 2026
Really helpful SMC tool that is accurate on charts over 30 mins, take it in context wit order blocks and youll have a good combination. Problem as always with pinescript though, you people dont know how to code the colors properly. They candle coloring should be optional, the coloring levels are way off. IE when it should be green is red etc, throws the trader off. Pay more attention, please update!
May 3, 2026
Ngl, structure is easier to read and that is enough to keep testing it. Deep Fib area is the line to watch.
ディスカッション
よくあるご質問
SMA
Key Levels
BOS
Market Structure
Supply & Demand
ATR
cTrader Storeで入手可能な取引ボット、インジケーター、プラグインなどの商品は、第三者の開発者が提供するものであり、情報と技術の取得のみを目的としてご利用いただけます。cTrader Storeはブローカーではなく、投資助言や個人的な推奨を行うことも、将来のパフォーマンスを保証することもありません。


価格
登録日 03/10/2024
163
販売
39.22K
無料インストール