
Description
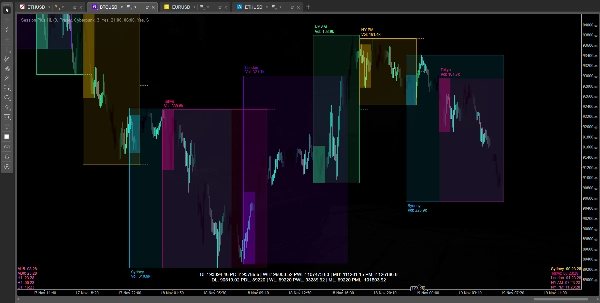
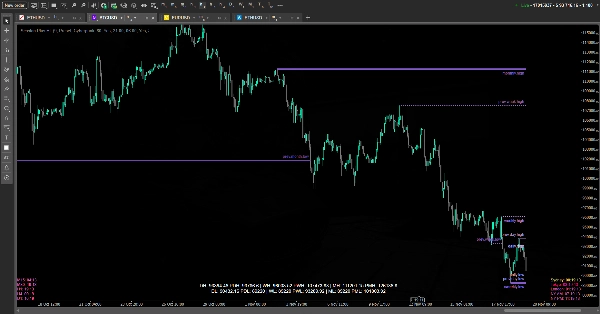
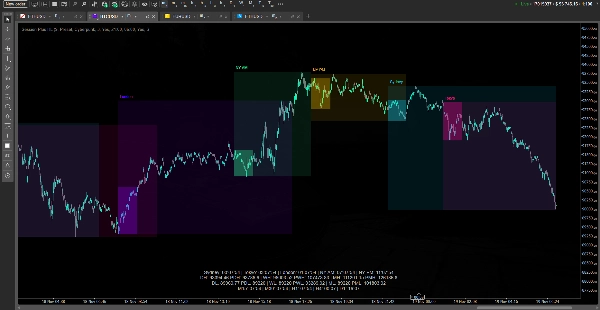
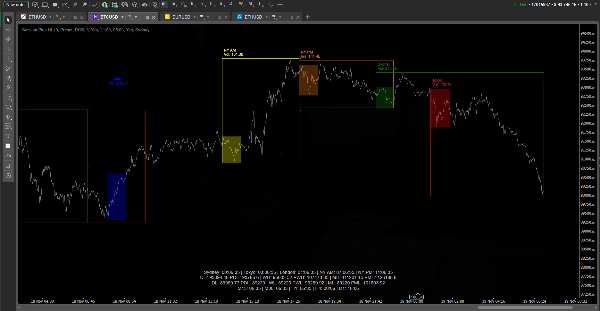
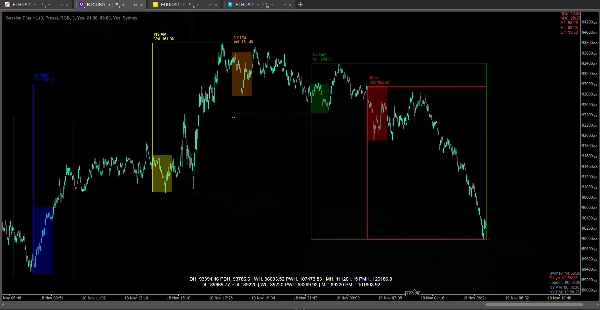
Cet indicateur est conçu pour visualiser la structure du marché et le contexte temporel pour les traders intrajournaliers. Il trace automatiquement les principales sessions de trading (Sydney, Tokyo, Londres, New York AM/PM) sous forme de boîtes sur le graphique, affiche leurs niveaux hauts/bas et les niveaux intermédiaires optionnels, et peut mettre en évidence une plage d'Initial Balance (IB) à l'intérieur de chaque session. Il trace également les niveaux de référence clés des unités de temps supérieures — les plus hauts et les plus bas du jour/semaine/mois en cours et précédent — et les affiche à la fois sous forme de lignes sur le graphique et sous forme de tableau de bord compact, afin que vous puissiez toujours voir où se situe le prix par rapport aux pools de liquidité récents.
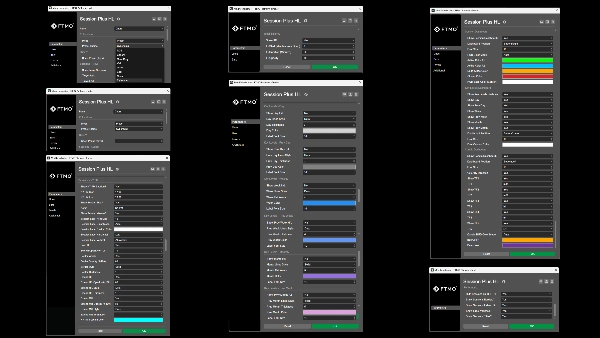
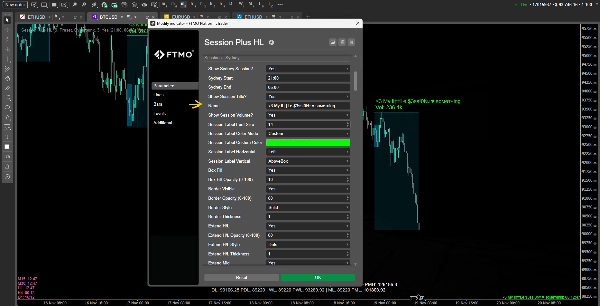
En plus de cela, l'indicateur fournit plusieurs HUD : un tableau de bord des sessions montrant le temps restant avant l'ouverture ou la fermeture de chaque session, un tableau de bord des niveaux clés résumant toutes les valeurs H/B quotidiennes/hebdomadaires/mensuelles, et un tableau de bord des chandeliers qui affiche le temps restant dans les chandeliers sur plusieurs unités de temps supérieures ainsi que leur état haussier/baissier. Tous les visuels sont personnalisables (préréglages de couleurs ou couleurs personnalisées), peuvent être ajustés pour la performance (masquage des sessions sur les unités de temps supérieures, contrôle des extrémités de lignes au lieu d'extensions dynamiques lourdes), et sont conçus pour soutenir l'analyse des balayages de liquidité, des plages de session et du timing sans encombrer ni ralentir le graphique.
Résumé
Avis clients
5 | 0 % | |
4 | 50 % | |
3 | 50 % | |
2 | 0 % | |
1 | 0 % |


