
Описание
🔍 Анализирует данные объема за определенный исторический период, выделяя потенциальные области, где инвесторы с высокой кредитной нагрузкой могут столкнуться с ликвидациями, предоставляя ценные инсайты о поведении рынка.
Что делает этот индикатор?
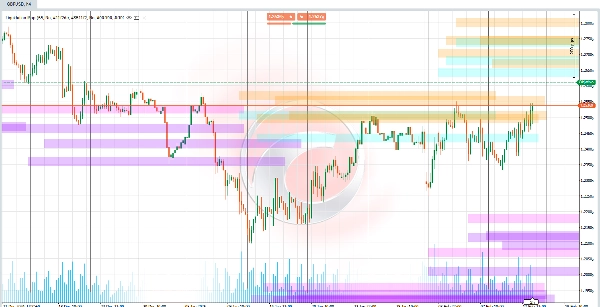
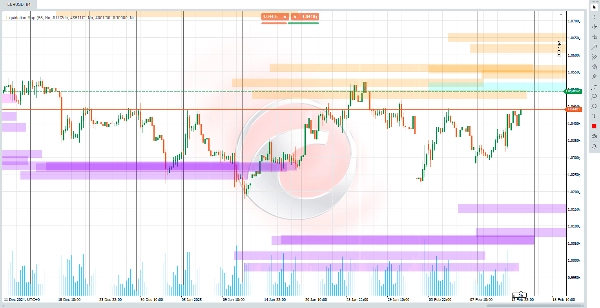
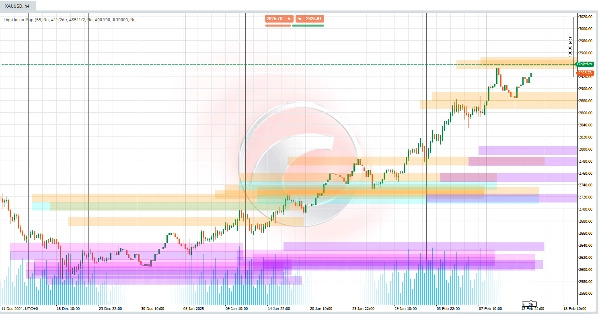
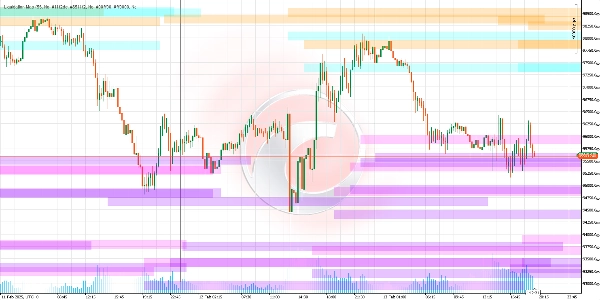
Этот алгоритм определяет ценовые уровни, где вероятны массовые ликвидации маржинальных позиций (например, 5x, 10x, 25x, 50x или 100x). Эти уровни действуют как "магниты" для движения цены, поскольку ликвидации могут вызвать резкие колебания рынка. Индикатор рисует горизонтальные линии на графике, представляющие эти пороги и проецирующие их в будущее для предсказания ключевых зон интереса.
Как рассчитываются эти уровни?
- Обнаружение ценовых пивотов:
🔄 Определяет недавние максимумы и минимумы на графике (точки, где цена меняет направление). Эти пивоты служат основой для расчета уровней ликвидации. - Объем как триггер:
📊 Сравнивает текущий объем с историческим средним. Если объем превышает определенные пороги (например, 1.2x среднего для 100x), активируются соответствующие уровни ликвидации. - Формула ликвидации:
Чем выше кредитное плечо, тем ближе уровень ликвидации к текущей цене. -
- Для лонг-позиций: уровень ликвидации устанавливается ниже пивотного минимума, рассчитываемого на основе кредитного плеча (например, на 2% ниже для 50x).
- Для шорт-позиций: уровень устанавливается выше пивотного максимума, по тому же принципу.
Чего ожидать при использовании?
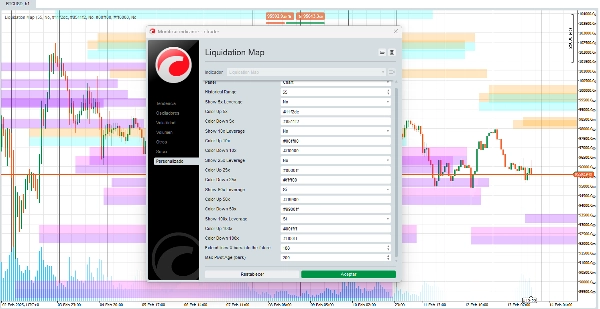
- Линии ликвидности: 🎨 Вы увидите настраиваемые горизонтальные линии, представляющие зоны, где рынок может испытывать высокую волатильность из-за ликвидаций.
- Настраиваемые кредитные плечи: ⚙️ Можно включать/отключать уровни для каждого типа плеча (например, сосредоточиться только на 50x и 100x).
- Настройка цвета: 🌈 Можно выбрать цвет для каждого диапазона ликвидации, адаптируя визуализацию под свои предпочтения.
- Зоны скопления: 🎯 Несколько линий, расположенных близко друг к другу, указывают на зоны с высоким риском/высокой наградой, где может произойти множественная ликвидация одновременно.
Как интерпретировать сигналы?
- Цена приближается к линии: 🚨 Если цена подходит к уровню ликвидации (особенно при высоком объеме), вероятность резкого движения возрастает.
- Цвет и прозрачность: 🎨 Цвета варьируются в зависимости от плеча (например, синий для 25x, оранжевый для 50x). Прозрачность указывает на "силу" связанного объема (темные линии = более значительный объем).
Почему это полезно?
- Проактивное прогнозирование: 🔮 Анализирует не только прошлое, но и проецирует будущие уровни на основе текущих условий.
- Фокус на психологии рынка: 🧠 Вынужденные ликвидации часто создают цепные реакции (например, стоп-лоссы вызывают дополнительные распродажи). Этот индикатор помогает их предвидеть.
- Настройка: 🛠️ Адаптируйте визуализацию под свою стратегию (например, приоритет для высоких плеч на волатильных рынках).
Ограничения, которые следует учитывать
- Зависимость от объема: 📉 При низком объеме или недостаточных исторических данных сигналы могут быть менее надежными.
- Не хрустальный шар: 🔮 Уровни указывают вероятные зоны, а не гарантии. Всегда комбинируйте с другими анализами.
- Динамичная среда: 🌍 На рынках с неожиданными новостями ликвидации могут происходить вне проецируемых уровней.
Индикаторы Ctrader Store:
Dynamic Market Structure
Analysis of Turning Points
Fibonacci Linear
Regression Multi-timeframe
Multi-Level Candle Bias
Tracker
Auto Support and
Resistance Trend Lines
Сводка
Отзывы покупателей
5 | 67 % | |
4 | 0 % | |
3 | 33 % | |
2 | 0 % | |
1 | 0 % |


