Описание
▁▂▃▄▅▆▇ █ 10,000+ трейдеров (институциональных + розничных) █ ▇▆▅▄▃▂▁
- Выберите наши ТОП индикаторы в cTrader 🏆
- ✨ Эксклюзивная точность для превосходных результатов ✨
- 📈 Наши алгоритмы — с самыми высоко оценёнными визуализациями 🎯—
- успешно внедрены в 2 квантовых фонда
▁▂▃▄▅▆▇ █████████████████████████████ ▇▆▅▄▃▂▁
_______________________________________________
_______________________________________________
📌 Индикаторы структуры рынка
· ✅ AdvancedMarket Structure: Bos, Choch, SwinLevels, Order Blocks, Market Structure& Liquidity Finder
· 🔄 Dynamic Market StructureAnalysis of Turning Points
· 🧱 Order Block
· ⚖️ Market Imbalance
· ⛓️ BOS & CHOCH
· 🧠 ICT Power of 3
______________________________________________________________-
Магазин cBots : 🧠 Gold & BTC BreakoutSession Pivots 🧠
_______________________________________________
🔚 Системы умного выхода
_______________________________________________
📐 Индикаторы ZigZag
· 🔍 ZigZag Price LiquidityProjection
· ➖ ZigZag
_______________________________________________
🧱 Индикаторы поддержки и сопротивления
· 🟩 SmartTrend Support &Resistance Lines
· 🧱 All Support and ResistanceLevels
_______________________________________________
📊 Индикаторы тренда и каналов
· 📊 Supertrend
_______________________________________________
💧 Инструменты объёма и ликвидности
_______________________________________________
⚡ Индикаторы импульса и RSI
· 🔎 Multi-Level Candle BiasTracker
_______________________________________________
🔮 Инструменты прогнозирования и проекции
· 📐 Прогноз на основе Linreg& ATR
· 📏 Фибоначчи линейная регрессияМульти-таймфрейм
· 📈 Проектор рыночного потока на основе объёма
______________________________________________________________________________________________________
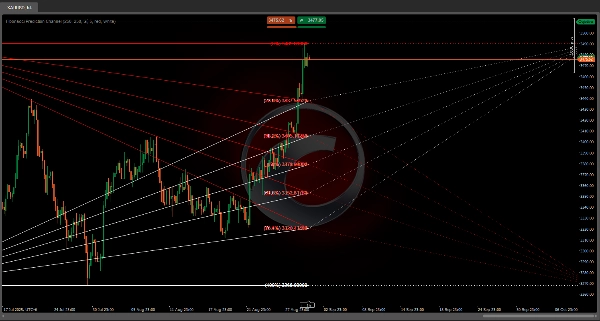
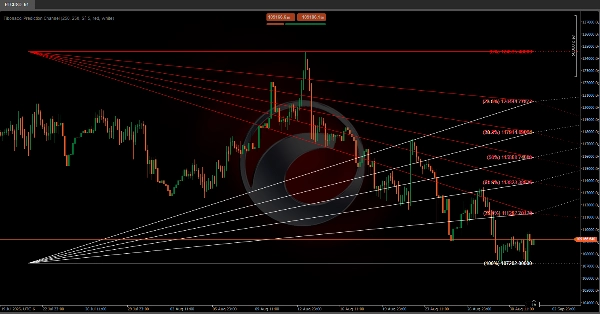
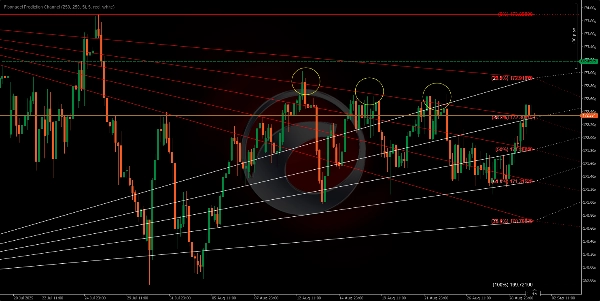
Этот алгоритм предназначен для построения канала будущего прогноза на основе уровней коррекции Фибоначчи 📊✨. Линии Фибоначчи создают серию параллельных каналов между каждой парой последовательных уровней. Эти каналы можно интерпретировать как диапазоны, в пределах которых ожидается колебание цены 📈📉, создавая визуальный конус, с которым цена будет взаимодействовать 🎯. Если уровень пробивается ⚡, мы переходим к следующему.
Эти уровни, которые мы проецируем в будущее, также выступают в роли поддержки и сопротивления 🛡️⚔️, создавая визуальные каналы на графике, которые могут помочь нам предвидеть и планировать действия 🧠✅ на основе того, как цена реагировала на эти уровни в прошлом.
Мы можем ожидать, что цена будет реагировать по мере приближения к этим линиям 🔍, потенциально отскакивая обратно внутри канала 🔄 или, если будет достаточно импульса 🚀, пробивая линии для перехода к следующему каналу.
Уровни, проецируемые вправо ➡️🗓️, не основаны на новых данных о цене, а на прошлом движении цены ⏳. Они простираются в будущее как своего рода "карта" 🗺️ для потенциальных будущих реакций цены.
Исторические бары ⏰: Определяет, сколько прошлых периодов цены будет учитываться при расчёте уровней коррекции Фибоначчи.