
Description
using cAlgo.API;
using cAlgo.API.Indicators;
using cAlgo.API.Internals;
using System;
namespace cAlgo.Indicators
{
[Indicator(TimeZone = TimeZones.UTC, AccessRights = AccessRights.None)]
public class DojiStrategyIndicator : Indicator
{
[Parameter("Taille du Doji", DefaultValue = 0.05, MinValue = 0.01, Step = 0.01)]
public double DojiSize { get; set; }
[Parameter("Ratio de la Bougie Longue", DefaultValue = 0.7, MaxValue = 1, Step = 0.1)]
public double LongCandleRatio { get; set; }
[Parameter("Utiliser le filtre de volume ?", DefaultValue = false)]
public bool UseVolumeFilter { get; set; }
[Parameter("Période de la Moyenne Mobile du Volume", DefaultValue = 24)]
public int VolumeMA { get; set; }
[Parameter("Période du RSI", DefaultValue = 14)]
public int RSIPeriod { get; set; }
[Parameter("Ratio Mèche-Corps", DefaultValue = 2.5, MinValue = 1.0, Step = 0.1)]
public double WickToBodyRatio { get; set; }
private MovingAverage volumeMA;
private RelativeStrengthIndex rsi;
[Output("Signal Doji", Color = Colors.Orange, PlotType = PlotType.Points, Thickness = 2)]
public IndicatorDataSeries DojiSignal { get; set; }
protected override void Initialize()
{
if (UseVolumeFilter)
volumeMA = Indicators.MovingAverage(MarketSeries.TickVolume, VolumeMA, MovingAverageType.Simple);
rsi = Indicators.RelativeStrengthIndex(MarketSeries.Close, RSIPeriod);
}
public override void Calculate(int index)
{
double body = MarketSeries.Close[index] - MarketSeries.Open[index];
double range = MarketSeries.High[index] - MarketSeries.Low[index];
double abody = Math.Abs(body);
double ratio = abody / range;
bool isDoji = abody <= range * DojiSize;
bool goStar = isDoji && (!UseVolumeFilter || MarketSeries.TickVolume[index] > volumeMA.Result[index]);
if (goStar && IsHigherTimeFrame(out int timeFrameNumber, out string label))
{
DojiSignal[index] = MarketSeries.Close[index]; // Marquer le Doji sur le graphique
Chart.DrawIcon("Doji" + TimeFrame.ToString() + index, ChartIconType.Diamond, index, MarketSeries.Close[index], Color.Orange);
// Mettre en évidence le plus haut et le plus bas de la bougie Doji avec des lignes pleines qui s'étendent sur les 3 bougies suivantes
HighlightDojiHighLow(index, timeFrameNumber, label);
}
// La détection de divergence SMT est maintenant appliquée à toutes les périodes
DetectSMTDivergence(index);
}
private bool IsHigherTimeFrame(out int timeFrameNumber, out string label)
{
timeFrameNumber = 0;
label = string.Empty;
if (TimeFrame == TimeFrame.Minute15)
{
timeFrameNumber = 15;
label = "0.25";
return true;
}
else if (TimeFrame == TimeFrame.Minute30)
{
timeFrameNumber = 30;
label = "0.5";
return true;
}
else if (TimeFrame == TimeFrame.Minute45)
{
timeFrameNumber = 45;
label = "0.75";
return true;
}
else if (TimeFrame == TimeFrame.Hour)
{
timeFrameNumber = 1;
label = "1";
return true;
}
else if (TimeFrame == TimeFrame.Hour2)
{
timeFrameNumber = 2;
label = "48";
return true;
}
else if (TimeFrame == TimeFrame.Hour4)
{
timeFrameNumber = 4;
label = "4";
return true;
}
else if (TimeFrame == TimeFrame.Daily)
{
timeFrameNumber = 24;
label = "24";
return true;
}
else if (TimeFrame == TimeFrame.Weekly)
{
timeFrameNumber = 168;
label = "W";
return true;
}
else if (TimeFrame == TimeFrame.Monthly)
{
timeFrameNumber = 720;
label = "M";
return true;
}
return false;
}
private void HighlightDojiHighLow(int dojiIndex, int timeFrameNumber, string label)
{
double dojiHigh = MarketSeries.High[dojiIndex];
double dojiLow = MarketSeries.Low[dojiIndex];
// Dessiner des lignes horizontales pleines au plus haut et au plus bas de la bougie Doji s'étendant sur les 3 bougies suivantes
Chart.DrawTrendLine("DojiHighLine" + TimeFrame.ToString() + dojiIndex, dojiIndex, dojiHigh, dojiIndex + 3, dojiHigh, Color.Blue, 2, LineStyle.Solid).IsInteractive = true;
Chart.DrawTrendLine("DojiLowLine" + TimeFrame.ToString() + dojiIndex, dojiIndex, dojiLow, dojiIndex + 3, dojiLow, Color.Red, 2, LineStyle.Solid).IsInteractive = true;
// Ajouter le numéro de la période ou le texte de l'étiquette à côté de la ligne bleue
Chart.DrawText("TimeFrameHigh" + TimeFrame.ToString() + dojiIndex, label, dojiIndex + 3, dojiHigh, Color.Green).IsInteractive = true;
}
private void DetectSMTDivergence(int index)
{
// Vérifier si le plus haut ou le plus bas actuel forme une divergence avec le RSI
double currentHigh = MarketSeries.High[index];
double currentLow = MarketSeries.Low[index];
double prevHigh = MarketSeries.High[index - 1];
double prevLow = MarketSeries.Low[index - 1];
double currentRSI = rsi.Result[index];
double prevRSI = rsi.Result[index - 1];
bool isWickDivergence = IsWickDivergence(index, currentHigh, currentLow, prevHigh, prevLow);
if (isWickDivergence)
{
// Divergence baissière : le prix fait un plus haut plus élevé, le RSI fait un plus haut plus bas
if (currentHigh > prevHigh && currentRSI < prevRSI)
{
// Marquer la divergence sur le graphique avec un identifiant unique pour cette période
Chart.DrawIcon("BearishDivergence" + TimeFrame.ToString() + index, ChartIconType.DownArrow, index, currentHigh, Color.Red);
}
// Divergence haussière : le prix fait un plus bas plus bas, le RSI fait un plus bas plus élevé
if (currentLow < prevLow && currentRSI > prevRSI)
{
// Marquer la divergence sur le graphique avec un identifiant unique pour cette période
Chart.DrawIcon("BullishDivergence" + TimeFrame.ToString() + index, ChartIconType.UpArrow, index, currentLow, Color.Green);
}
}
}
private bool IsWickDivergence(int index, double currentHigh, double currentLow, double prevHigh, double prevLow)
{
double currentBody = Math.Abs(MarketSeries.Close[index] - MarketSeries.Open[index]);
double currentRange = currentHigh - currentLow;
double prevBody = Math.Abs(MarketSeries.Close[index - 1] - MarketSeries.Open[index - 1]);
double prevRange = prevHigh - prevLow;
// Déterminer si la bougie actuelle a un petit corps et de longues mèches
bool currentHasLongWicks = (currentHigh - MarketSeries.Close[index]) > currentBody * WickToBodyRatio &&
(MarketSeries.Open[index] - currentLow) > currentBody * WickToBodyRatio;
// Déterminer si la bougie précédente a un petit corps et de longues mèches
bool prevHasLongWicks = (prevHigh - MarketSeries.Close[index - 1]) > prevBody * WickToBodyRatio &&
(MarketSeries.Open[index - 1] - prevLow) > prevBody * WickToBodyRatio;
return currentHasLongWicks || prevHasLongWicks;
}
}
}


![Logo de "[Hamster-Coder] Pivot Points MTF"](https://cdn.ctrader.com/image/webp/4c143e5a-309c-40e3-a578-f04d1e133ffa_31159)


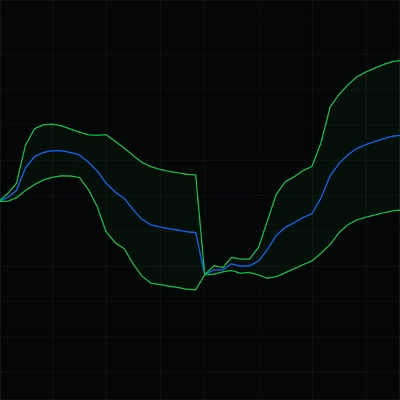
![Logo de "[Stellar Strategies] Visual Trend Momentum"](https://cdn.ctrader.com/image/webp/48aee0a5-f10e-4bc8-9671-78e156fcc5df_27548)


