Descrição
HCCC MTF - Canal Composto do Ciclo de Hurst (100% GRÁTIS)
Visão Geral
O HCCC MTF (Canal Composto do Ciclo de Hurst) é um painel e indicador de canal Multi-Temporal (MTF) avançado e totalmente interativo. Baseado nas teorias cíclicas de J.M. Hurst combinadas com a volatilidade ATR, esta ferramenta ajuda você a identificar a verdadeira tendência do mercado e os pontos cíclicos perfeitos de reversão (picos e vales) em múltiplos períodos simultaneamente.
O segundo dedicado ao trading semi-automático com https://ctrader.com/products/3618?u=cLogic
IMPORTANTE: Este indicador é completamente 100% GRÁTIS para todos. Foi desenvolvido especificamente como o companheiro visual definitivo para o cBot "Follow The Trend XAU Edition".
Embora você possa usá-lo perfeitamente para trading manual, seu verdadeiro poder é desbloqueado quando usado em uma configuração semi-automatizada: você usa o Painel HCCC para ler o ciclo e o momentum do timeframe superior e então ativa o cBot Follow The Trend XAU Edition para executar e gerenciar precisamente as operações nessa direção.
Principais Características
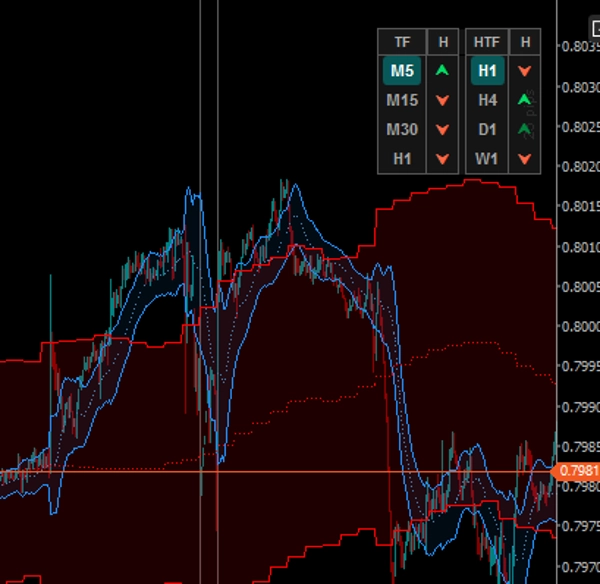
1. Painel MTF Interativo (Clicável)
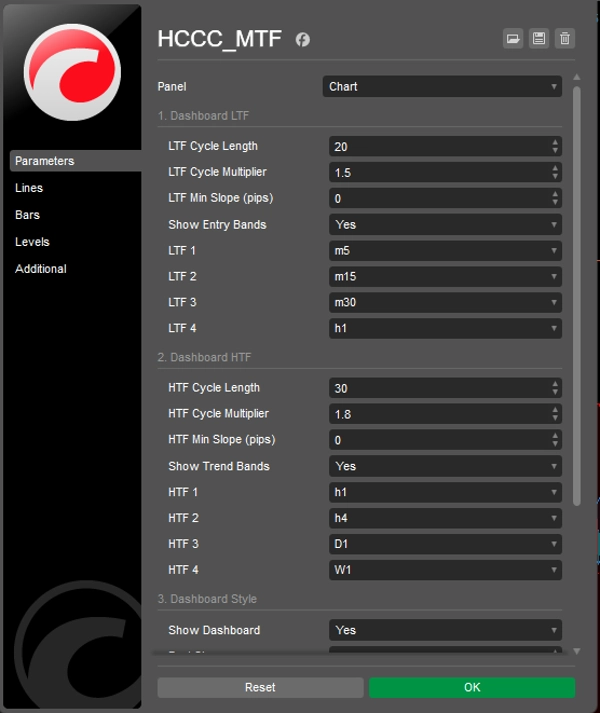
Esqueça ficar alternando entre gráficos. O painel no gráfico acompanha 4 Timeframes Inferiores (LTF) e 4 Timeframes Superiores (HTF).
- Botões LTF: Clique em qualquer botão LTF para mudar instantaneamente o timeframe do seu gráfico atual.
- Botões HTF: Clique em qualquer botão HTF para projetar instantaneamente o canal daquele Timeframe Superior específico diretamente no seu gráfico atual!
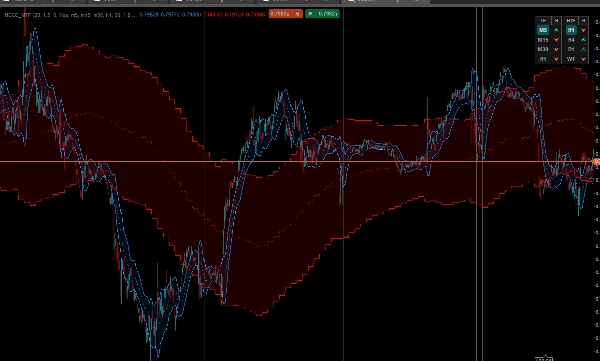
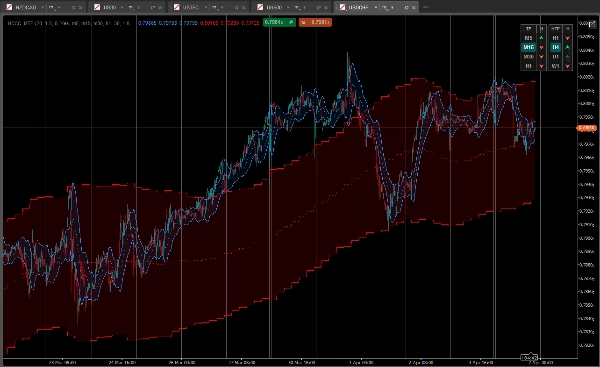
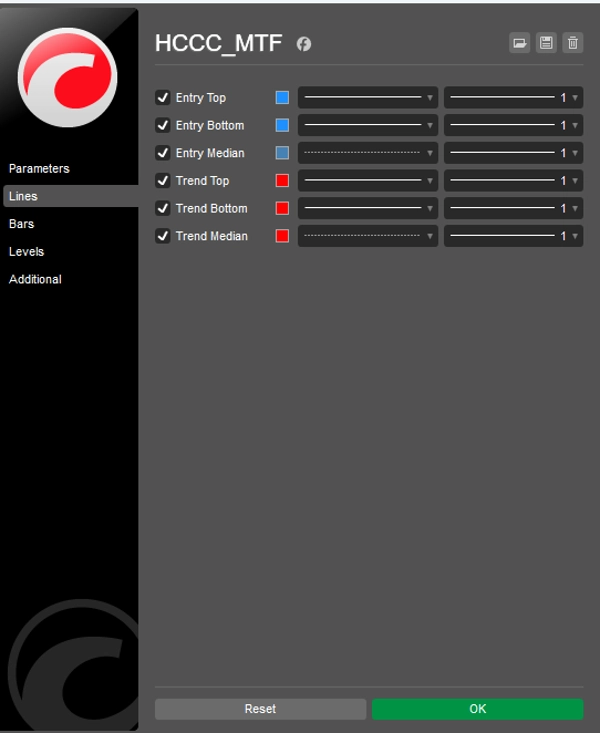
2. Sistema de Sobreposição de Canal Duplo
O indicador plota dois canais elegantes, preenchidos por nuvens, no seu gráfico ao mesmo tempo:
- Ciclo de Entrada (Nuvem Azul): Calcula o ciclo de Hurst baseado no timeframe do gráfico atual.
- Ciclo de Tendência (Nuvem Vermelha): Um canal de visão macro calculado a partir do Timeframe Superior que você selecionou no painel.
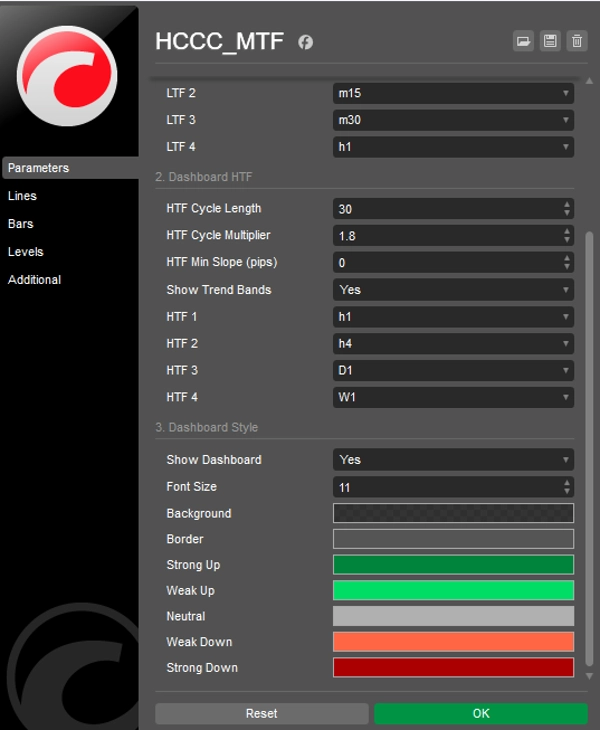
3. Sinais Cíclicos Avançados de 5 Estados
O painel não mostra apenas a direção da tendência; ele mostra a fase do ciclo analisando a inclinação da linha mediana e a posição do preço em relação às bandas ATR.
- [ ⮝ ] Verde Escuro (Compra Forte): A inclinação mediana está PARA CIMA, e o preço caiu até a banda inferior. Este é um vale cíclico (compre na queda).
- [ ⮝ ] Verde Claro (Compra Fraca): A tendência está PARA CIMA, mas o preço está flutuando em torno da mediana ou banda superior.
- [ — ] Cinza (Neutro): O ciclo está plano. Sem momentum claro.
- [ ⮟ ] Vermelho Claro (Venda Fraca): A tendência está PARA BAIXO, mas o preço está próximo da mediana.
- [ ⮟ ] Vermelho Escuro (Venda Forte): A inclinação mediana está PARA BAIXO, e o preço subiu até a banda superior. Este é um pico cíclico (venda na alta).
Como usar com o cBot "Follow The Trend XAU Edition"?
- Observe o lado direito do painel (Coluna HTF). Espere um alinhamento claro nos Timeframes Superiores (ex.: H4 e D1 mostrando Setas Verde Escuro/Claro).
- Observe o lado esquerdo do painel (Coluna LTF) para encontrar um pullback localizado (ex.: M15 mostrando uma seta Verde Escuro "Compra Forte").
- Quando a lógica MTF se alinhar, ative seu cBot Follow The Trend XAU Edition na direção "BUY" e deixe seus algoritmos cuidarem da entrada, stops móveis e gerenciamento de risco.
Personalização
Tudo é totalmente personalizável: comprimentos do ciclo, multiplicadores ATR, sensibilidade mínima da inclinação (em pips) para filtrar ruído, e controle total sobre as cores e posicionamento da interface.
Baixe agora GRATUITAMENTE e leve seu trading semi-automatizado para o próximo nível!
Resumo
It overlays two cloud-filled channels: a blue "Entry Cycle" channel based on the current timeframe and a red "Trend Cycle" channel derived from a selected higher timeframe. The dashboard provides advanced five-state cyclic signals indicating strong or weak buy/sell conditions and neutral phases by analyzing the slope of the median line and price position relative to ATR bands.
The indicator is fully customizable, including cycle lengths, ATR multipliers, slope sensitivity, and UI appearance. It is intended to complement the "Follow The Trend XAU Edition" cBot by providing visual cycle and momentum analysis to guide semi-automated trade execution and management. The HCCC MTF supports various markets including Forex, commodities, indices, stocks, and cryptocurrencies.