
Descrição
MFI-MTF: Índice de Fluxo de Dinheiro Multi-Temporal
Visão Geral
MFI-MTF é um indicador de momentum multi-temporal que traz a perspectiva de um timeframe superior para o seu gráfico atual. Ao calcular o Índice de Fluxo de Dinheiro (MFI) em um timeframe maior e exibi-lo no seu gráfico de trabalho, este indicador ajuda a identificar condições de sobrecompra e sobrevenda em múltiplas perspectivas de mercado sem a necessidade de alternar manualmente entre timeframes.
O Que Ele Faz
Análise do Índice de Fluxo de Dinheiro: O indicador mede a pressão de compra e venda analisando tanto o movimento de preço quanto o volume de negociação. Ele oscila entre 0 e 100, identificando quando um ativo experimentou pressão excessiva de compra (sobrecomprado) ou venda (sobrevendido).
Contexto de Timeframe Superior: Em vez de calcular o MFI no timeframe atual do seu gráfico, o MFIMTF puxa dados de um timeframe maior que você especificar (diário, semanal, 4 horas, etc.). Isso oferece insights de momentum em nível institucional sem o ruído dos timeframes inferiores. Quando o MFI diário mostra condições de sobrecompra, por exemplo, você sabe que a tendência maior está se esgotando — um contexto valioso para decisões de entrada e saída.
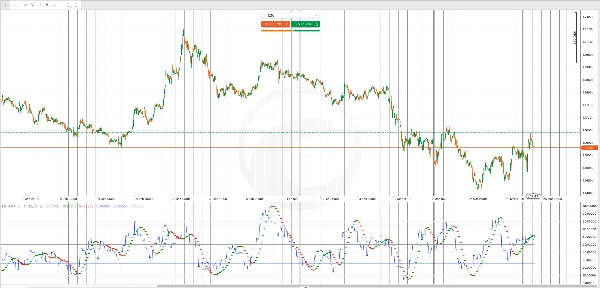
Filtro da Média Móvel Hull: Uma Média Móvel Hull (HMA) aplicada ao MFI suaviza os movimentos erráticos e destaca mudanças na direção do momentum. Pontos verdes indicam tendências de alta no momentum, enquanto pontos vermelhos indicam tendências de baixa, oferecendo uma confirmação visual rápida das mudanças na direção do momentum.
Principais Resultados
Linha MFI (Azul): O valor principal do Índice de Fluxo de Dinheiro do timeframe superior selecionado, exibido em cada barra do seu gráfico atual.
Sinais HMA (Pontos Verdes/Vermelhos): Pontos verdes aparecem quando o momentum está se fortalecendo para cima; pontos vermelhos aparecem quando o momentum está enfraquecendo ou revertendo para baixo. Eles servem como sinais de alerta precoce para possíveis reversões.
Níveis de Referência:
- Nível de Sobrecompra (padrão 70): Quando o MFI ultrapassa este valor, a pressão de compra é excessiva e reversões tornam-se prováveis
- Nível de Sobrevenda (padrão 30): Quando o MFI cai abaixo deste valor, a pressão de venda está esgotada e recuperações tornam-se prováveis
- Linha do Meio (50): O ponto de equilíbrio neutro entre momentum de alta e baixa
Personalização
Seleção de Timeframe: Escolha qualquer timeframe superior ao do seu gráfico atual (diário em um gráfico de 1 hora, por exemplo). Timeframes maiores fornecem um contexto de tendência mais amplo, mas sinais menos frequentes; incrementos menores oferecem mais oportunidades de negociação, porém com uma perspectiva menos estratégica.
Período do MFI: Ajuste o período de retrocesso para o Índice de Fluxo de Dinheiro (padrão 14). Períodos mais curtos tornam o indicador mais responsivo às mudanças recentes no volume; períodos mais longos suavizam a volatilidade e reduzem sinais falsos.
Período do HMA: Controle a suavização do filtro de momentum. Períodos mais curtos tornam as mudanças de tendência mais óbvias, porém mais ruidosas; períodos mais longos confirmam tendências com mais confiabilidade, mas com geração de sinais mais lenta.
Limiares de Sobrecompra/Sobrevenda: Personalize esses níveis para combinar com seu estilo de negociação. Traders conservadores podem usar 75/25; traders agressivos podem usar 80/20 para aguardar condições mais extremas.
Uso Prático
Use o MFI MTF para adicionar confluência às suas entradas e saídas. Um sinal de venda no seu timeframe de trabalho torna-se mais confiável se o MFI diário já estiver sobrecomprado, indicando que vendedores institucionais provavelmente estão ativos. Da mesma forma, sinais de compra ganham força quando o MFI do timeframe superior está sobrevendido, mostrando que a pressão de venda foi esgotada em nível macro.
As mudanças de cor do HMA fornecem alertas em tempo real sobre mudanças no momentum, ajudando você a sair de negociações perdedoras cedo ou reduzir o tamanho da posição antes que reversões se tornem severas.
Resumo
The indicator includes a Hull Moving Average (HMA) filter applied to the MFI to smooth out noise and highlight momentum shifts. Green dots indicate strengthening upward momentum, while red dots signal weakening or downward momentum. Reference levels include default overbought (70), oversold (30), and a neutral midpoint (50), all customizable to fit different trading styles.
Key outputs are the MFI line from the chosen higher timeframe and HMA signals for momentum direction changes. Adjustable parameters include the MFI lookback period, HMA smoothing period, and overbought/oversold thresholds. MFI-MTF aids in confirming entry and exit points by providing institutional-level momentum insights and real-time alerts to momentum shifts on your working chart.
Avaliações de clientes
5 | 100 % | |
4 | 0 % | |
3 | 0 % | |
2 | 0 % | |
1 | 0 % |


