
Descrição
Teoria da Caixa Darvas
A teoria da Caixa Darvas é uma técnica de negociação desenvolvida por Nicolas Darvas na década de 1950. É uma estratégia de negociação baseada em momentum que usa a ação do preço para identificar potenciais pontos de entrada e saída no mercado.
Como Funciona a Caixa Darvas
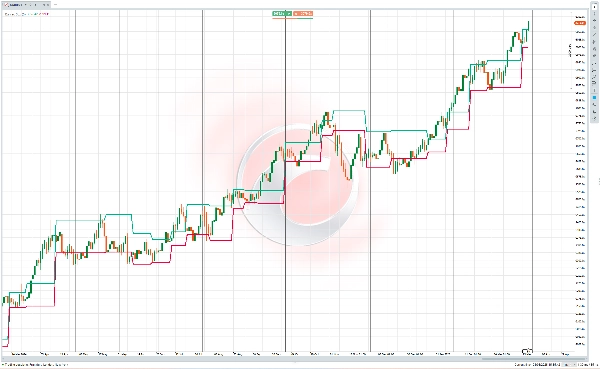
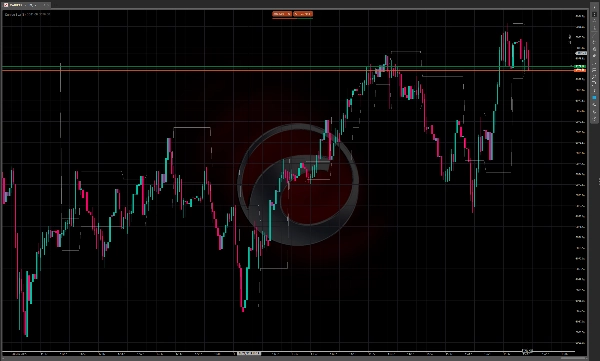
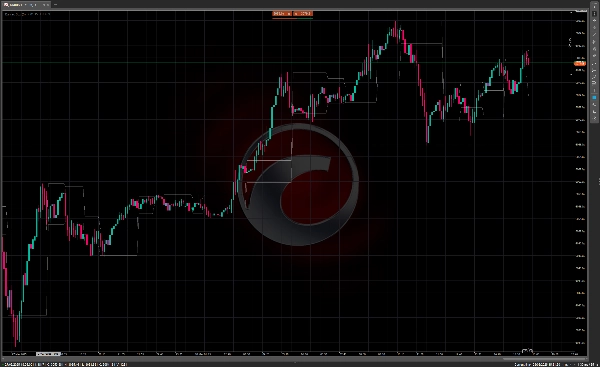
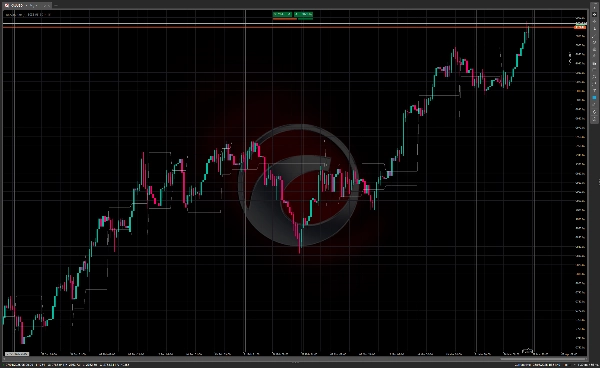
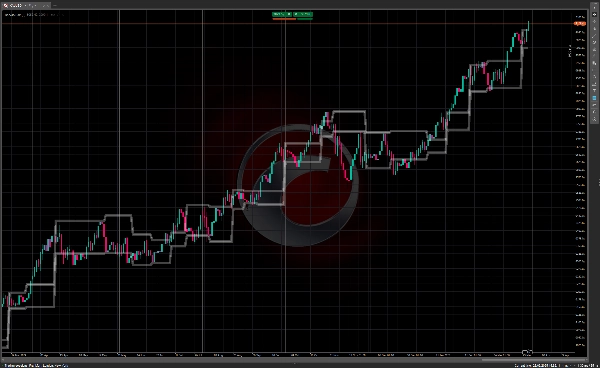
O método da Caixa Darvas envolve identificar "caixas" ou faixas de negociação onde o preço de uma ação se consolida antes de romper. Os componentes principais incluem:
- O preço forma uma faixa de negociação definida (a "caixa") com limites superiores e inferiores claros
- O limite superior representa resistência, enquanto o limite inferior atua como suporte
- Um rompimento acima da caixa sinaliza uma potencial oportunidade de compra
- Uma queda abaixo da caixa pode ser usada como sinal de venda
Os traders que usam esta técnica normalmente procuram ações que mostram aumento de volume junto com o movimento do preço, pois isso sugere um momentum mais forte por trás do rompimento.
História da Teoria da Caixa Darvas
Nicolas Darvas (1920-1977) foi uma figura bastante incomum na história do trading. Nascido na Hungria, ele não era um trader profissional de formação, mas sim um dançarino que se apresentava em uma dupla de dança de salão chamada "Darvas e Julia" com sua meia-irmã.
Enquanto viajava pelo mundo com sua companhia de dança na década de 1950, Darvas começou a experimentar o trading de ações. Suas circunstâncias eram únicas — ele frequentemente tomava decisões de investimento baseando-se apenas nas tabelas de ações dos jornais que recebia em várias cidades durante sua turnê.
Darvas desenvolveu sua teoria da caixa por meio de tentativa e erro. Inicialmente, ele perdeu dinheiro nos mercados, mas gradualmente refinou sua abordagem. Entre 1956 e 1958, ele supostamente transformou um investimento de $10.000 em mais de $2 milhões usando seu método da caixa — uma façanha extraordinária que chamou atenção.
Em 1960, Darvas publicou seus métodos no livro "Como Eu Ganhei $2.000.000 no Mercado de Ações", que se tornou um clássico na literatura de trading. O livro detalhou sua jornada e explicou sua teoria da caixa, trazendo essa abordagem para a atenção do público em geral.
O que tornou o método de Darvas particularmente notável foi sua simplicidade e o fato de ter sido desenvolvido por alguém de fora da indústria financeira. Ele focava principalmente na ação do preço e no volume, em vez da análise fundamental, uma abordagem que era um tanto nova na época, mas que desde então influenciou muitos sistemas técnicos de negociação.
A técnica da Caixa Darvas continua popular entre traders técnicos hoje em dia, especialmente aqueles que seguem estratégias baseadas em momentum em mercados com tendência.


