
On Balance Volume
Indicador
247 transferências
Versão 1.0, Dec 2024
Windows, Mac
5.0
Avaliações: 1
Descrição
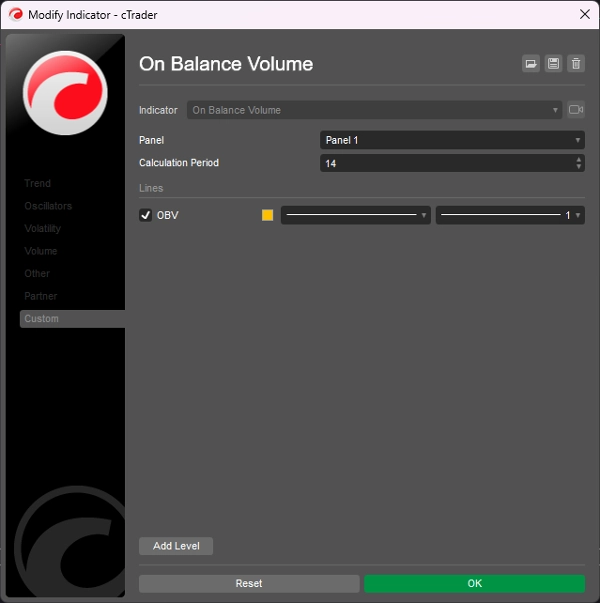
O On Balance Volume (OBV) mede a pressão de compra e venda como um indicador cumulativo que adiciona volume nos dias de alta e subtrai volume nos dias de baixa.
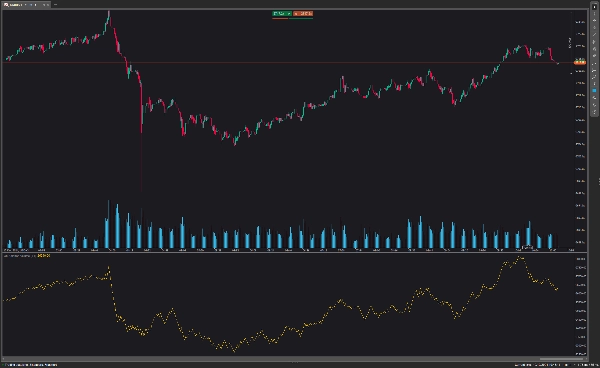
O On Balance Volume é exibido na parte inferior do gráfico. A linha OBV sobe quando o preço de fechamento de hoje aumenta e desce quando o preço de fechamento de ontem é maior que o atual.
O indicador OBV geralmente identifica um rompimento antes da linha de preço e ajuda a estabelecer uma tendência clara de alta. Se você quiser operar com essa estratégia, abra uma posição forex no nível de preço do rompimento e coloque um stop loss acima do último topo recente.
Resumo
Resumo de IA
On Balance Volume (OBV) is a technical indicator that measures buying and selling pressure by cumulatively adding volume on days when the closing price rises and subtracting volume on days when it falls. Displayed at the bottom of the chart, the OBV line moves upward when today's closing price exceeds the previous day's and moves downward when it is lower. This indicator is used to identify potential breakouts ahead of price movements and to confirm upward trends. Traders using OBV may open positions at breakout price levels and set stop losses above recent high swings. The indicator is applicable in forex markets and supports breakout trading strategies.
Perfil do indicador
Avaliações de clientes
5.0
Avaliações: 1
5 | 100 % | |
4 | 0 % | |
3 | 0 % | |
2 | 0 % | |
1 | 0 % |
Avaliações de clientes
August 18, 2025
Pros: A lightweight cumulative volume indicator that confirms price moves and detects divergences. Excellent for analyzing trend strength and sentiment. Cons: No alerts, tooltips, or template features. Signals may lag in volatile or manipulated markets.
Conversa
Perguntas frequentes
Forex
Breakout
Os produtos disponíveis através da cTrader Store, incluindo bots de negociação, indicadores e plugins, são fornecidos por programadores terceiros e são disponibilizados apenas para fins informativos e de acesso técnico. A cTrader Store não é um corretor e não fornece aconselhamento em matéria de investimento, recomendações pessoais ou qualquer garantia de desempenho no futuro.
Mais deste autor


Preço
2
Vendas
6.9K
Instalações gratuitas