
Descrição
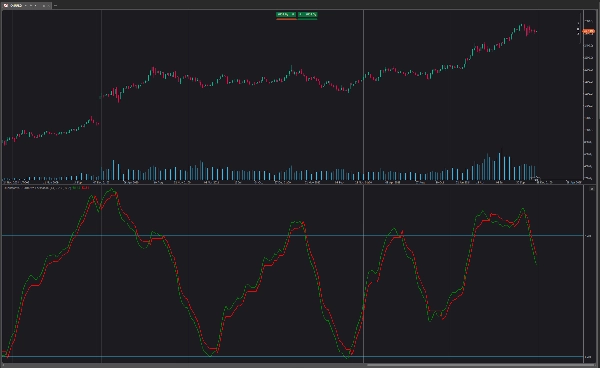
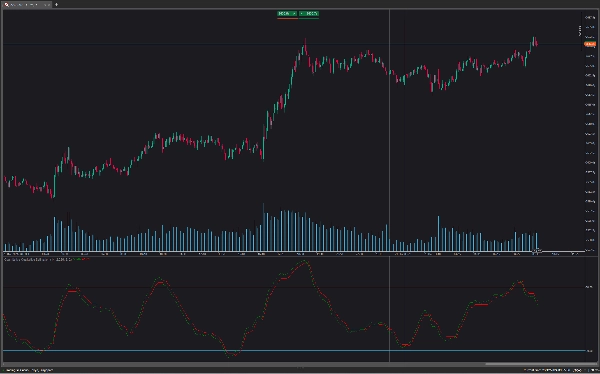
O Oscilador Ponderado QQE (Quantitative Qualitative Estimation) melhora sua versão original ao ponderar o RSI com base nas indicações dadas pelo trailing stop, exigindo mais esforço para que ocorra um cruzamento com o trailing stop. O Oscilador Ponderado QQE é composto por um oscilador RSI suavizado e um trailing stop derivado desse mesmo RSI.
O oscilador pode ser usado para indicar se o mercado está sobrecomprado/sobrevendido, bem como uma indicação precoce de reversões de tendência graças à natureza líder do RSI.
Usar valores mais altos de Factor resultará em um trailing stop de longo prazo.
Assim como com um RSI regular, divergências podem indicar uma reversão.
Uma ponderação adicional controlará quanto "esforço" é necessário para que o trailing stop cruze o RSI. Por exemplo, um RSI acima do trailing stop exigirá um grau maior de variações negativas de preço para que um cruzamento potencial ocorra ao usar pesos mais altos.
Isso pode fazer com que ponderações mais altas retornem resultados mais cíclicos e suaves.
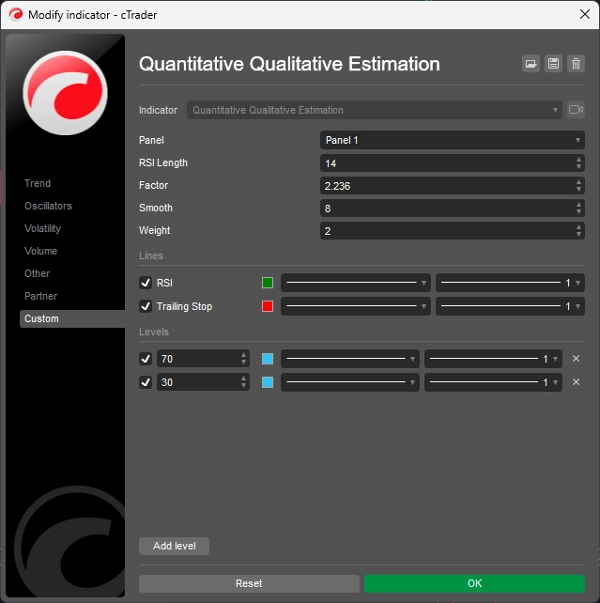
Como alterar as configurações:
- Length: Comprimento do oscilador RSI.
- Factor: Fator multiplicativo usado para o cálculo do trailing stop.
- Smooth: Grau de suavização do oscilador RSI.
- Weight: Grau de ponderação usado para o cálculo do RSI.
Resumo
Avaliações de clientes
5 | 100 % | |
4 | 0 % | |
3 | 0 % | |
2 | 0 % | |
1 | 0 % |


