
Breakout Mode Patterns
مؤشر
417 التنزيلات
الإصدار 1.0، Feb 2025
Windows, Mac
الوصف
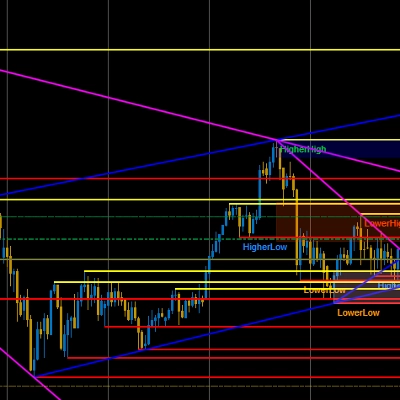
يكتشف هذا المؤشر ثلاثة أنواع من أنماط حركة السعر:
ii - أشرطة داخلية متتالية (القمة والقاع داخل الشريط السابق)، مثلث على إطار زمني أدنى
oo - أشرطة خارجية متتالية (القمة فوق قمة الشريط السابق والقاع تحت قاع الشريط السابق)، مثلث متسع على إطار زمني أدنى
ioi - داخل خارج داخل، نمط الماسة على إطار زمني أدنى
المتداولون الذين يتداولون هذه الأنماط يدخلون عند اختراقات فوق/تحت. عندما تظهر في سوق متجه، فهي إعدادات جيدة لكل من تداولات الاستمرار والانعكاس. عندما تظهر في سوق متذبذب، فهي ليست قوية بنفس القدر لأن معظم الاختراقات تفشل في هذا السياق. لتحقيق أعلى احتمال، من الأفضل التداول في اتجاه الاتجاه على الشريط الأخير في النمط مع وضع وقف خسارة على الجانب الآخر والسعي لتحقيق مكافأة لا تقل عن ضعف المخاطرة.
الملخص
ملخص الذكاء الاصطناعي
Breakout Mode Patterns is a technical indicator that identifies three specific price action patterns: consecutive inside bars ("ii"), consecutive outside bars ("oo"), and inside-outside-inside ("ioi"). These patterns correspond to formations such as triangles and diamond shapes on lower timeframes. The indicator is designed to assist traders in recognizing breakout setups, particularly in trending markets where these patterns can signal continuation or reversal swing trades. Trading signals are generated when price breaks above or below the pattern boundaries. For optimal use, it is recommended to trade in the direction of the trend indicated by the last bar in the pattern, with a stop loss placed on the opposite side and targeting a reward at least twice the risk. The indicator is less effective in ranging markets due to a higher likelihood of false breakouts.
ملف تعريف المؤشر
تقييمات العملاء
0.0
التقييمات: 0
تقييمات العملاء
لا توجد تقييمات لهذا المنتج حتى الآن. هل جرَّبته بالفعل؟ كن أول من يخبر الآخرين!
مناقشة
الأسئلة الشائعة
يتم توفير المنتجات المتاحة من خلال cTrader Store، بما في ذلك روبوتات التداول والمؤشرات والإضافات، من قبل مطوري الطرف الثالث وإتاحتها لأغراض الوصول المعلوماتي والفني فقط. cTrader Store ليس وسيطًا ولا يقدم نصائح استثمارية أو توصيات شخصية أو أي ضمان للأداء المستقبلي.


![شعار "[Stellar Strategies] Market Session Ultimate"](https://cdn.ctrader.com/image/webp/61ffd537-0125-4246-9e72-42eca1791d64_28232)


السعر
منذ 24/09/2024
182.5M
حجم التداول
700.47K
الربح بالبيب
960
التثبيتات المجانية