
StochasticRSI
อินดิเคเตอร์
1.16K ดาวน์โหลด
เวอร์ชัน 1.0, Nov 2024
Windows, Mac
5.0
รีวิว: 1
คำอธิบาย
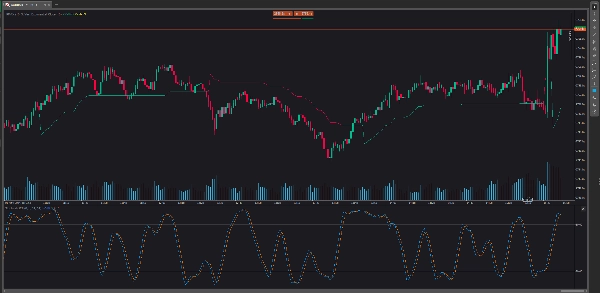
Stochastic RSI (StochRSI) เป็นตัวชี้วัดการวิเคราะห์ทางเทคนิคที่ใช้สนับสนุนการทำนายตลาดหุ้นโดยการเปรียบเทียบช่วงราคาของหลักทรัพย์กับราคาปิด StochRSI มีความโดดเด่นตรงที่เน้นไปที่โมเมนตัมของตลาดและมีความสามารถในการอ่านสภาวะตลาดที่ซื้อมากเกินไปและขายมากเกินไปได้ดี StochRSI แตกต่างจากตัวชี้วัดทางเทคนิคอื่น ๆ เช่น Relative Strength Index (RSI) เพราะมันเคลื่อนที่จากราคาซื้อมากเกินไปไปยังราคาขายมากเกินไปได้เร็วกว่าระดับ RSI.
สรุป
สรุปโดย AI
Stochastic RSI (StochRSI) is a technical analysis indicator designed to assess market momentum by comparing a security's price range to its closing price. It is used primarily to identify overbought and oversold conditions in stock markets, providing faster signals than the traditional Relative Strength Index (RSI). Unlike RSI, StochRSI moves more rapidly between overbought and oversold levels, making it useful for traders seeking timely momentum insights. This indicator supports analysis across various indices and is categorized under momentum indicators, specifically related to RSI.
โปรไฟล์อินดิเคเตอร์
รีวิวจากลูกค้า
5.0
รีวิว: 1
5 | 100 % | |
4 | 0 % | |
3 | 0 % | |
2 | 0 % | |
1 | 0 % |
รีวิวจากลูกค้า
July 9, 2025
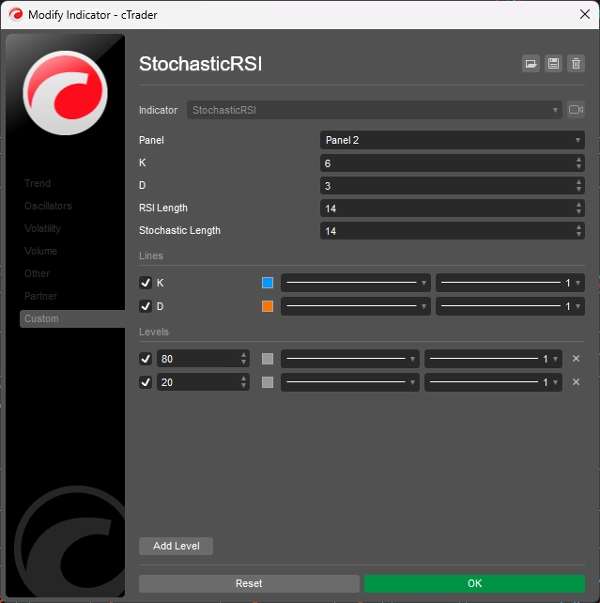
Pros: Combines Stochastic Oscillator and RSI for improved overbought/oversold detection. Easy to set up, stable on all timeframes. Cons: No tooltips or alerts. Requires confirmation from trend indicators to avoid false signals. Limited customization options.
การสนทนา
คำถามที่พบบ่อย
Indices
RSI
ผลิตภัณฑ์ที่มีให้บริการผ่าน cTrader Store รวมถึงบอทการเทรด อินดิเคเตอร์ และปลั๊กอิน มีให้บริการโดยนักพัฒนาบุคคลที่สามและมีไว้เพื่อวัตถุประสงค์ในการเข้าถึงข้อมูลและทางเทคนิคเท่านั้น cTrader Store ไม่ใช่โบรกเกอร์และไม่ได้ให้คำแนะนำการลงทุน คำแนะนำส่วนบุคคล หรือการรับประกันผลการดำเนินงานในอนาคต
เพิ่มเติมจากผู้เขียนคนนี้


!["High-Low Divergence [Iridio Capital]" โลโก้](https://cdn.ctrader.com/image/webp/443c4661-7abb-40f1-842f-4b6ec560649b_40914)


ราคา
2
การขาย
6.9K
ติดตั้งฟรี