คำอธิบาย
SMC_Guardian_Visual_Pro ควบคุมโครงสร้างตลาดอย่างแม่นยำด้วยสถาบัน
SMC Guardian Visual Pro เป็นเครื่องมือแสดงผลประสิทธิภาพสูงสำหรับ cTrader ที่ออกแบบมาเพื่อเชื่อมช่องว่างระหว่าง Smart Money Concepts (SMC) ที่ซับซ้อนและการเทรดที่นำไปปฏิบัติได้จริง มันระบุการตั้งค่าที่มีความน่าจะเป็นสูงโดยการรวมลำดับชั้นแนวโน้ม ช่องว่างสภาพคล่อง และการเปลี่ยนแปลงโครงสร้าง
อินดิเคเตอร์นี้ทำหน้าที่เป็น "สมอง" ทางสายตาสำหรับเครื่องมืออัตโนมัติระดับพรีเมียมของเรา ช่วยให้คุณเห็นอย่างชัดเจนว่าธนาคารใหญ่เคลื่อนไหวตลาดอย่างไร ก่อนที่คุณจะตั้งค่าวิธีการเทรดอัตโนมัติของคุณ
🚀 เสาหลักการวิเคราะห์สำคัญ
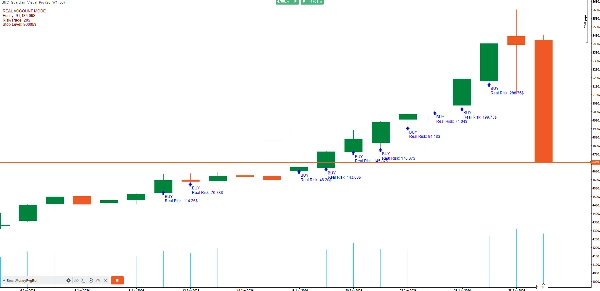
- ตัวกรองแนวโน้ม HTF (บริบทคือราชา): อย่าเทรดสวนกระแส อินดิเคเตอร์ดึงข้อมูลจาก กรอบเวลาที่สูงกว่า (เช่น รายสัปดาห์) โดยใช้ SMA 50 ช่วงเวลาเพื่อให้แน่ใจว่าสัญญาณทุกตัวสอดคล้องกับทิศทางสถาบันระยะยาว
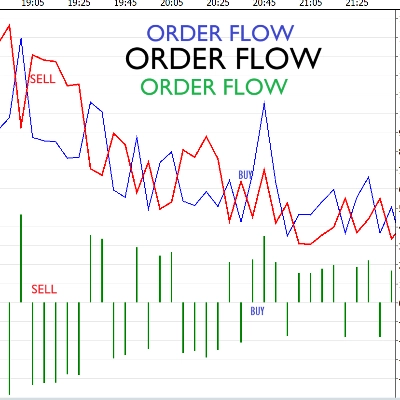
- การตรวจจับ FVG (แม่เหล็ก): ระบุโดยอัตโนมัติ ช่องว่างมูลค่ายุติธรรม (ความไม่สมดุล) มันมองหาการขยายราคาที่รุนแรงซึ่งตลาดทิ้ง "ธุรกิจที่ยังไม่เสร็จ"
- การยืนยัน BOS (ตัวกระตุ้น): สัญญาณจะปรากฏเฉพาะเมื่อมีการ เบรกโครงสร้าง ยืนยันแล้ว มันสแกน 20 แท่งล่าสุดเพื่อให้แน่ใจว่าตลาดได้เปลี่ยนโมเมนตัมจริงก่อนแจ้งเตือนคุณ
📊 การแสดงความเสี่ยงขั้นสูง
แตกต่างจากอินดิเคเตอร์ทั่วไป, Guardian Pro คำนวณการเปิดเผยทางคณิตศาสตร์ของคุณแบบเรียลไทม์:
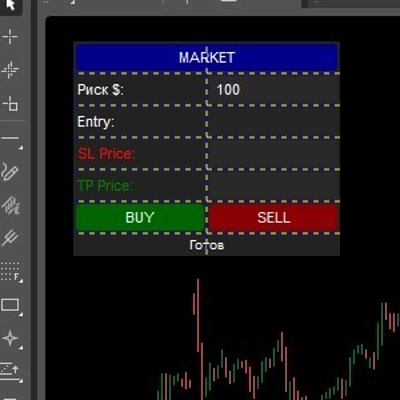
การคำนวณความเสี่ยงจริง: อินดิเคเตอร์วัดระยะทางไปยังจุดหยุดขาดทุนโครงสร้างของคุณและคำนวณปริมาณตำแหน่งที่แน่นอนตาม เป้าหมายความเสี่ยงเป็นดอลลาร์สหรัฐ มันแสดงป้าย "ความเสี่ยงจริง" บนแผนภูมิโดยตรงเพื่อให้คุณรู้การเปิดเผยดอลลาร์ของคุณก่อนคลิก "สั่งซื้อ"
🛠️ ข้อมูลจำเพาะทางเทคนิค
พารามิเตอร์
คำอธิบาย
เป้าหมายความเสี่ยง ($)
การขาดทุนที่คุณต้องการต่อการเทรดในสกุลเงินจริง
กรอบเวลาของแนวโน้ม
จุดยึด HTF (รายสัปดาห์/รายเดือน) สำหรับการกรองแนวโน้ม
ช่วง SMA
ช่วงเวลาสำหรับค่าเฉลี่ยเคลื่อนที่ที่กำหนดแนวโน้ม
ตรรกะสัญญาณ
การรวมกันของ BOS + FVG + การจัดแนว HTF
สรุป
รีวิวจากลูกค้า
5 | 100 % | |
4 | 0 % | |
3 | 0 % | |
2 | 0 % | |
1 | 0 % |


!["[Hamster-Coder] Bollinger Bands" โลโก้](https://cdn.ctrader.com/image/webp/21d8e5d6-fb11-4bac-b9ee-cd05c2b76804_30327)