
KDJ
Indicador
255 transferências
Versão 1.0, Dec 2024
Windows, Mac
5.0
Avaliações: 1
Descrição
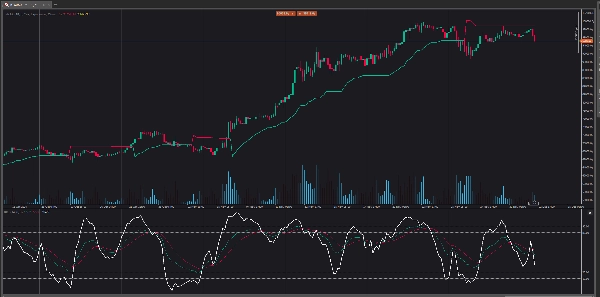
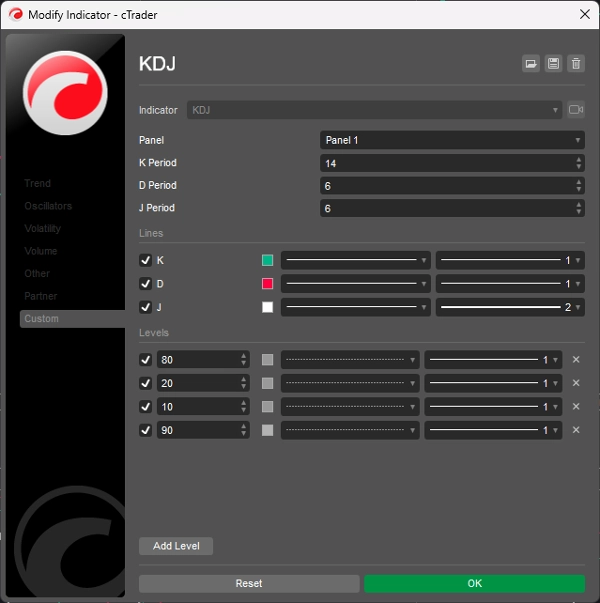
A exibição do oscilador KDJ consiste em 3 linhas (K, D e J - daí o nome da exibição) e 2 níveis. K e D são as mesmas linhas usadas no oscilador estocástico. A linha J representa a diferença do valor D em relação ao valor K. A convergência dessas linhas indica novas oportunidades de negociação. Assim como no Oscilador Estocástico, os níveis de sobrevenda e sobrecompra correspondem aos momentos em que a tendência provavelmente irá se reverter.
Resumo
Resumo de IA
The KDJ indicator is an oscillator consisting of three lines: K, D, and J, along with two reference levels. The K and D lines correspond to those used in the stochastic oscillator, while the J line measures the deviation of the D value from the K value. This convergence of the three lines is used to identify potential new trading opportunities. Similar to the stochastic oscillator, the KDJ indicator highlights overbought and oversold conditions, which often signal possible trend reversals. This tool is designed to assist traders in timing entries and exits by analyzing momentum and trend strength through these oscillating lines.
Perfil do indicador
Avaliações de clientes
5.0
Avaliações: 1
5 | 100 % | |
4 | 0 % | |
3 | 0 % | |
2 | 0 % | |
1 | 0 % |
Avaliações de clientes
August 18, 2025
Pros: Three-line stochastic oscillator (K, D, J) that identifies overbought/oversold levels and momentum shifts. Supports divergence analysis and crossovers between K and D as trading signals. Lightweight and responsive. Cons: No alerts, tooltips, or settings presets. J‑line can generate outlier v
Conversa
Perguntas frequentes
Os produtos disponíveis através da cTrader Store, incluindo bots de negociação, indicadores e plugins, são fornecidos por programadores terceiros e são disponibilizados apenas para fins informativos e de acesso técnico. A cTrader Store não é um corretor e não fornece aconselhamento em matéria de investimento, recomendações pessoais ou qualquer garantia de desempenho no futuro.
Mais deste autor


![Logótipo de "[Stellar Strategies] Market Regime Filter"](https://cdn.ctrader.com/image/webp/3bdeba11-7e8b-4e5f-9af9-d562f48df039_28423)


Preço
2
Vendas
6.9K
Instalações gratuitas