
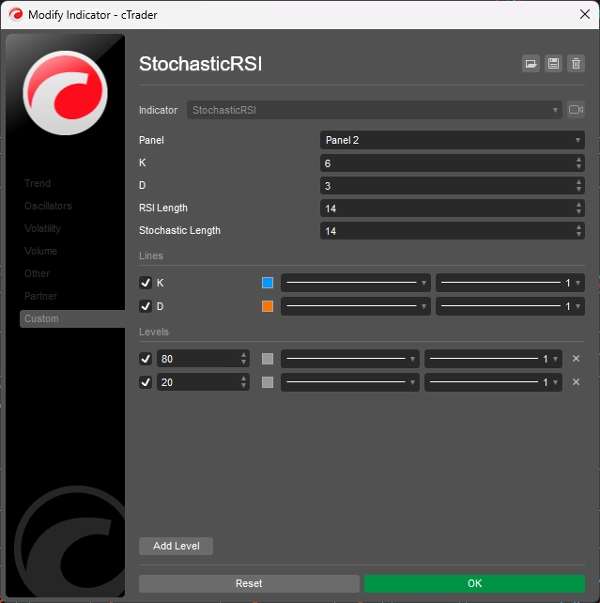
StochasticRSI
Indicador
1.16K transferências
Versão 1.0, Nov 2024
Windows, Mac
5.0
Avaliações: 1
Descrição
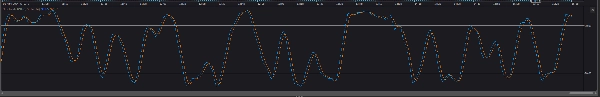
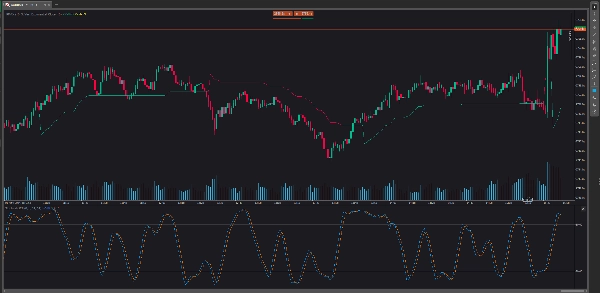
O RSI Estocástico (StochRSI) é um indicador de análise técnica usado para apoiar a previsão do mercado de ações, comparando a faixa de preço de um título com seu preço de fechamento. O StochRSI é único porque foca no momentum do mercado e é eficaz para identificar condições de mercado sobrecomprado e sobrevendido. O StochRSI difere de outros indicadores técnicos, como o Índice de Força Relativa (RSI), porque ele se move de preços sobrecomprados para sobrevendidos mais rapidamente do que o RSI.
Resumo
Resumo de IA
Stochastic RSI (StochRSI) is a technical analysis indicator designed to assess market momentum by comparing a security's price range to its closing price. It is used primarily to identify overbought and oversold conditions in stock markets, providing faster signals than the traditional Relative Strength Index (RSI). Unlike RSI, StochRSI moves more rapidly between overbought and oversold levels, making it useful for traders seeking timely momentum insights. This indicator supports analysis across various indices and is categorized under momentum indicators, specifically related to RSI.
Perfil do indicador
Avaliações de clientes
5.0
Avaliações: 1
5 | 100 % | |
4 | 0 % | |
3 | 0 % | |
2 | 0 % | |
1 | 0 % |
Avaliações de clientes
July 9, 2025
Pros: Combines Stochastic Oscillator and RSI for improved overbought/oversold detection. Easy to set up, stable on all timeframes. Cons: No tooltips or alerts. Requires confirmation from trend indicators to avoid false signals. Limited customization options.
Conversa
Perguntas frequentes
Indices
RSI
Os produtos disponíveis através da cTrader Store, incluindo bots de negociação, indicadores e plugins, são fornecidos por programadores terceiros e são disponibilizados apenas para fins informativos e de acesso técnico. A cTrader Store não é um corretor e não fornece aconselhamento em matéria de investimento, recomendações pessoais ou qualquer garantia de desempenho no futuro.
Mais deste autor


Preço
2
Vendas
6.9K
Instalações gratuitas