
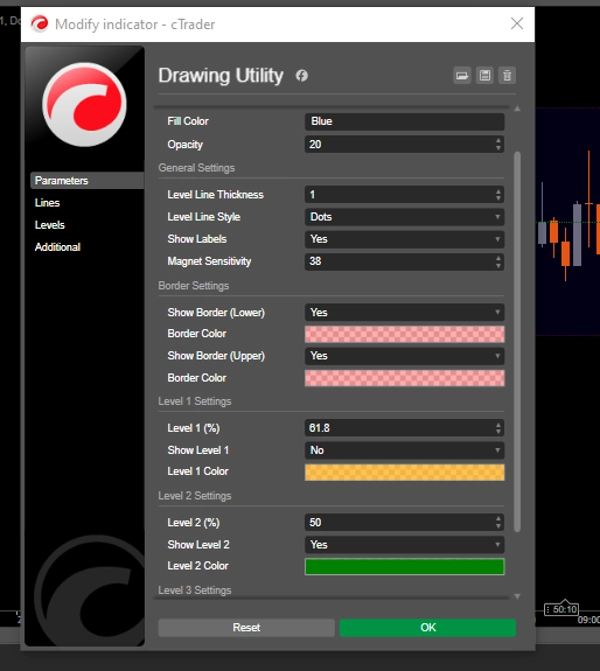
Drawing Utility
مؤشر
208 التنزيلات
الإصدار 1.0، Jul 2025
Windows, Mac
الوصف
اضغط Alt + السحب لتفعيله على مخططاتك.
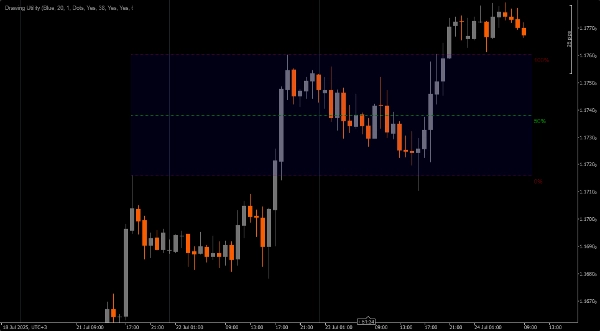
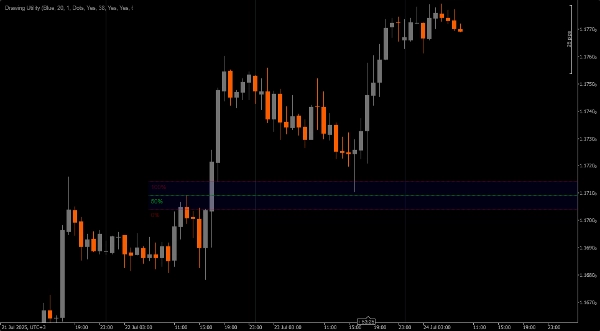
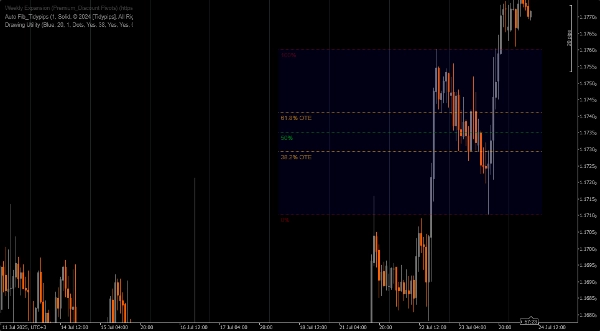
أداة رسم قابلة للتخصيص.
1. وصول سريع إلى فيبوناتشي.
2. مؤشر فجوة القيمة العادلة
3. أداة القياس
4. مؤشر نقطة الاهتمام
5. أو أي استخدام آخر (لم أفكر فيه) قد تجده مناسبًا لتدوين ملاحظات على مخططاتك
ملاحظة **اضغط Alt + السحب لتفعيله على مخططاتك.**
الملخص
ملخص الذكاء الاصطناعي
Drawing Utility is a customizable chart annotation tool designed for trading platforms. It features a rectangular box with five adjustable Fibonacci levels, which can also be customized to user-defined values. The utility is activated by pressing Alt and dragging on the chart. Key functionalities include quick access to Fibonacci retracement levels, marking Fair Value Gaps, measuring price movements, and highlighting Points of Interest. Additionally, it supports flexible use cases for various chart annotations, allowing traders to tailor it to their specific analysis needs.
ملف تعريف المؤشر
تقييمات العملاء
0.0
التقييمات: 0
تقييمات العملاء
لا توجد تقييمات لهذا المنتج حتى الآن. هل جرَّبته بالفعل؟ كن أول من يخبر الآخرين!
مناقشة
الأسئلة الشائعة
يتم توفير المنتجات المتاحة من خلال cTrader Store، بما في ذلك روبوتات التداول والمؤشرات والإضافات، من قبل مطوري الطرف الثالث وإتاحتها لأغراض الوصول المعلوماتي والفني فقط. cTrader Store ليس وسيطًا ولا يقدم نصائح استثمارية أو توصيات شخصية أو أي ضمان للأداء المستقبلي.
المزيد من هذا المؤلف


السعر
15
المبيعات
4.61K
التثبيتات المجانية