
설명
*자산 클래스별로 개장 시간이 다릅니다
*기본 시간 값은 NQ/ES/YM (선물) 기준입니다
*시간 값은 동부 표준시(EST)로 설정해야 합니다
주요 특징:
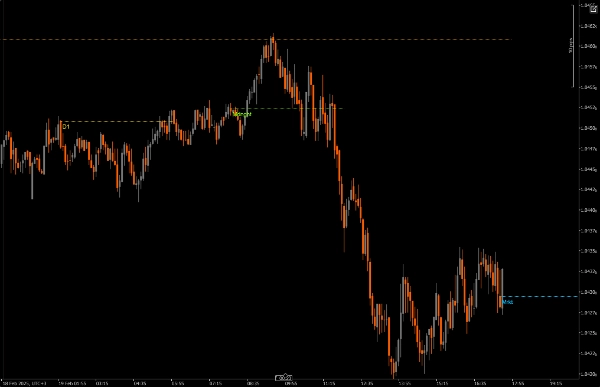
시간 기반 가격 수준
주요 시장 시간의 시가에 시가선 표시
모든 시간은 동부 표준시(EST)에 동기화됩니다
각 시간대는 쉽게 식별할 수 있도록 색상으로 구분됩니다
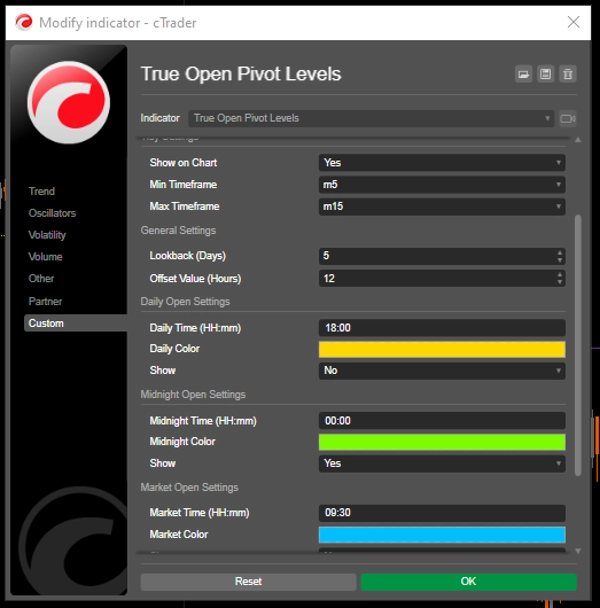
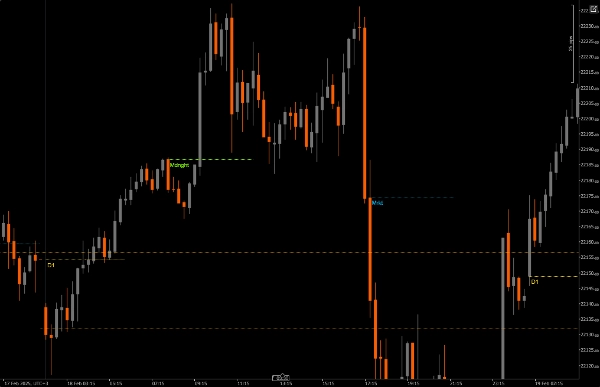
3가지 사용자 지정 세션 마커:
일일 개장 (동부 표준시 12:00 AM) - 기본 금색
자정 개장 (동부 표준시 4:00 AM) - 기본 녹색
시장 개장 (동부 표준시 9:30 AM) - 기본 파란색
각 세션은 독립적으로 켜고 끌 수 있습니다
시각적 사용자 지정:
조절 가능한 선 두께
다양한 선 스타일 (실선, 점선, 대시선)
각 세션별 사용자 지정 색상
EST 시간을 표시하는 선택적 시간 레이블
최대 48시간까지 설정 가능한 선 오프셋
유연한 시간 프레임 지원:
표시할 최소 및 최대 시간 프레임 설정
부적절한 시간 프레임에서 차트 혼잡 방지
M5-M15 시간 프레임에 최적화됨
시간 설정:
모든 시간은 EST 기준입니다
거래 전략에 맞게 세션 시간을 사용자 지정
분석 필요에 따라 선 지속 시간 조정
시각적 설정:
가시성을 위한 선 두께 조정
차트 명확성에 따른 선 스타일 선택
필요에 따라 레이블 활성화/비활성화
차트 테마에 맞게 색상 사용자 지정
일반 설정:
최소/최대 시간 프레임 정의
확장된 분석을 위한 선 지속 시간 조정
모범 사례:
기본 설정으로 시작하여 필요에 따라 조정
명확한 구분을 위해 각 세션에 다른 색상 사용
혼잡 방지를 위해 낮은 시간 프레임에서 선 지속 시간 줄이기 고려
처음에는 레이블을 활성화하여 타이밍을 이해하고, 차트가 너무 복잡해지면 비활성화
지표 시간 프레임 설정을 거래 시간 프레임에 맞추기
이 지표는 특히 다음에 유용합니다:
미국 시장에 집중하는 데이 트레이더
세션 개장을 추적해야 하는 트레이더
주요 시장 이벤트 주변에서 거래하는 사람들
다중 세션 가격 움직임을 분석하는 트레이더
EST 시장 시간에 대한 명확한 시각적 참조가 필요한 모든 사람
요약
고객 리뷰
5 | 100 % | |
4 | 0 % | |
3 | 0 % | |
2 | 0 % | |
1 | 0 % |


!["Gaussian Channel [Iridio Capital]" 로고](https://cdn.ctrader.com/image/webp/7c039209-5573-4a54-a072-f9528b503103_41960)


