
Descrição
Permite aos usuários marcar os horários de abertura e fechamento das principais sessões de negociação — Asiática, Londres, Nova York e Fechamento de Londres — com cores, estilos e espessuras personalizáveis. Este indicador desenha linhas de tendência altas e baixas para cada sessão, fornecendo insights sobre o comportamento do mercado. Com uma funcionalidade amigável de arrastar e soltar (+Tecla Alt), facilita a plotagem rápida das máximas e mínimas das sessões. Perfeito tanto para traders iniciantes quanto experientes, este indicador torna mais fácil navegar pelas complexidades das diferentes sessões de mercado.
Recursos
Horários de Sessão Personalizáveis: Os usuários podem definir os horários de abertura e fechamento das principais sessões de negociação (Asiática, Londres, Nova York e Fechamento de Londres), permitindo uma visualização personalizada que se adapta às suas estratégias de negociação.
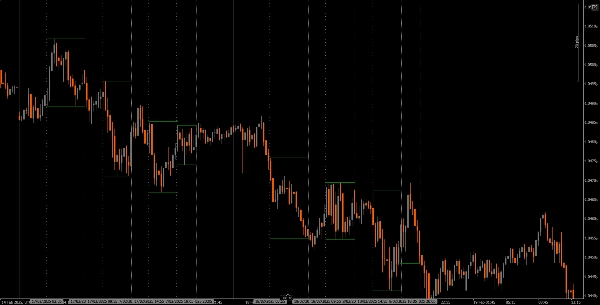
Linhas Verticais Dinâmicas: O indicador desenha linhas verticais nos horários de abertura e fechamento das sessões, facilitando a identificação rápida dos principais eventos do mercado.
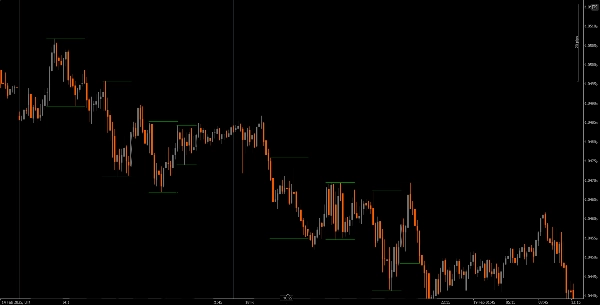
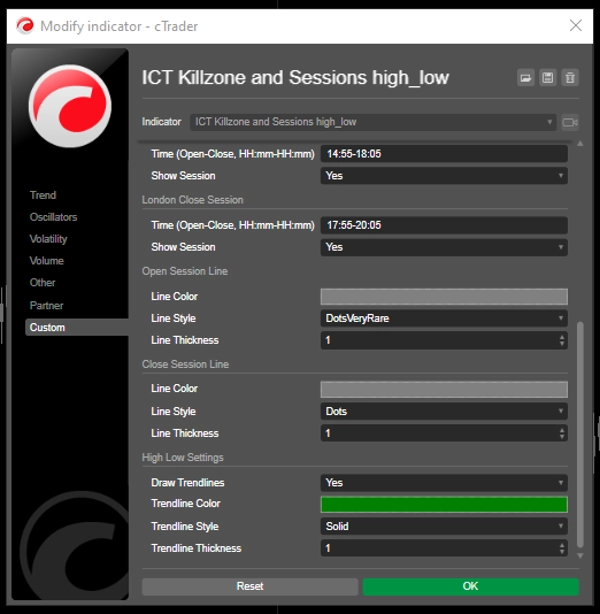
Visualização de Linhas de Tendência: Pode desenhar automaticamente linhas de tendência altas e baixas para cada sessão, permitindo que os traders vejam potenciais níveis de suporte e resistência com base na ação do preço da sessão.
Arrastar e Soltar Amigável (+Tecla Alt): A funcionalidade de arrastar e soltar (+Tecla Alt) permite que os traders selecionem facilmente intervalos de tempo específicos para análise, melhorando a experiência geral do usuário.
Etiquetas de Sessão: A opção de exibir etiquetas ao lado das linhas de tendência das sessões adiciona clareza, ajudando os traders a identificar rapidamente qual sessão estão analisando.
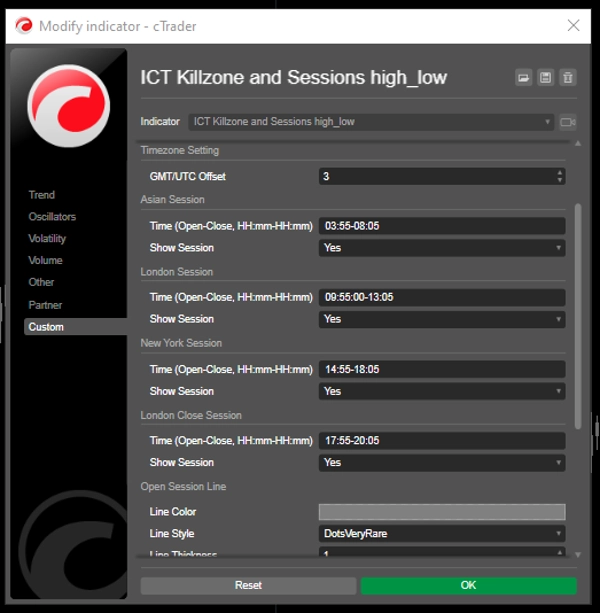
Ajuste de Fuso Horário: Os usuários podem definir um deslocamento GMT/UTC, garantindo que os horários das sessões sejam representados com precisão de acordo com seu fuso horário local.
Tutorial
Instalação: Baixe e instale o indicador The ICT Killzone and Sessions high_low na sua plataforma cAlgo.
Configuração: Abra as configurações para personalizar os horários das sessões, cores, estilos de linha e espessura conforme suas preferências.
Usando o Indicador: Clique e arraste (+ Tecla Alt) no gráfico para criar um retângulo que englobe o intervalo de tempo que deseja analisar. O indicador desenhará automaticamente linhas verticais e linhas de tendência para as sessões especificadas.
Análise: Observe as linhas das sessões e as linhas de tendência enquanto negocia. Use essas informações para identificar potenciais níveis de suporte e resistência com base na dinâmica das sessões.
Ferramentas Complementares Recomendadas
cTrader: A plataforma nativa para cAlgo, proporcionando uma experiência integrada para usar e personalizar indicadores.
Ferramentas de Análise de Mercado: Combine este indicador com ferramentas de análise de mercado, como médias móveis ou osciladores, para aprimorar sua estratégia de negociação.
Ferramentas de Gestão de Risco: Use calculadoras de tamanho de posição e ferramentas de stop-loss para gerenciar efetivamente o risco durante a negociação.
Ao integrar o indicador The ICT Killzone and Sessions high_low com essas ferramentas, os traders podem melhorar sua análise de mercado e aumentar suas chances de sucesso ao navegar pelas complexidades das diferentes sessões de negociação.
Resumo
A drag-and-drop (+Alt Key) feature allows quick selection of specific time ranges for analysis. Optional session labels clarify which session is being viewed. Timezone adjustments via GMT/UTC offset ensure session times align with the trader’s local time zone.
Designed for use on the cAlgo platform, this tool supports enhanced market analysis when combined with other market analysis and risk management tools. It assists traders in navigating the complexities of different market sessions by providing clear visual cues and trendline insights.
Avaliações de clientes
5 | 40 % | |
4 | 20 % | |
3 | 0 % | |
2 | 0 % | |
1 | 40 % |


