Descrição
🚀Projeção de Preço Volume de Oscilação: 📈
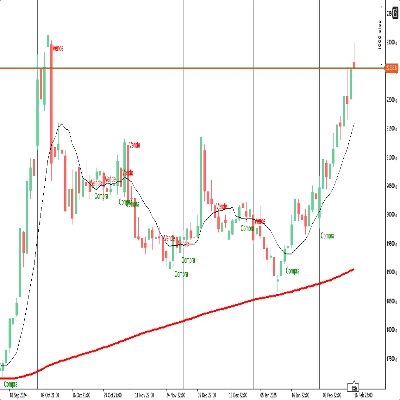
https://chartshots.spotware.com/c/6980f0f0287fb
A Projeção de Preço Volume de Oscilação é uma ferramenta avançada de previsão projetada para mapear o caminho futuro mais provável de um ativo com base nas oscilações recentes de preço e razões harmônicas de Fibonacci. Ela identifica a faixa atual do mercado e projeta um "mapa rodoviário" em múltiplas etapas para a potencial ação do preço.
🔍 Análise e Condições de Mercado
https://chartshots.spotware.com/c/6980f104dab21
Este algoritmo foca em identificar o "Envelope de Mercado" analisando:
- Pontos Extremos de Oscilação: Ele escaneia um Período de Retrospectiva específico (ex., últimas 50 barras) para encontrar a Máxima Alta e Mínima Baixa absolutas.
- Zonas de Retração: Calcula e plota automaticamente cinco níveis-chave de Fibonacci (23,6%, 38,2%, 50%, 61,8% e 78,6%) dentro da oscilação atual para identificar áreas de interesse.
- Projeções Harmônicas: Usando a Razão de Projeção (padrão 0.618), o algoritmo calcula um caminho futuro de três segmentos baseado em movimentos medidos a partir do ponto de oscilação mais recente.
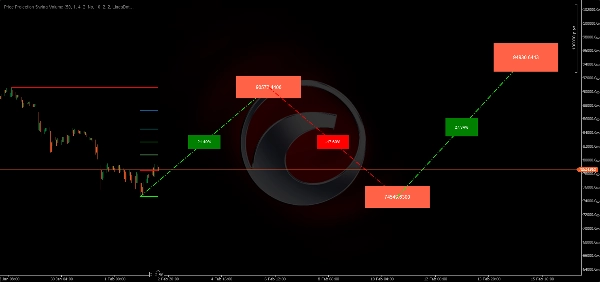
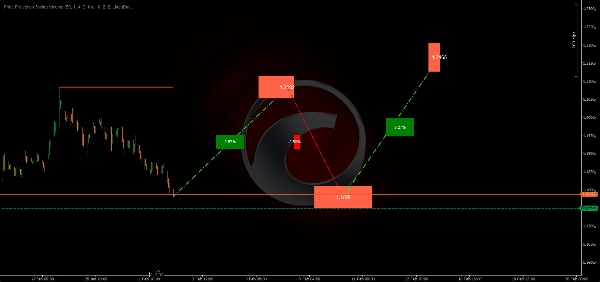
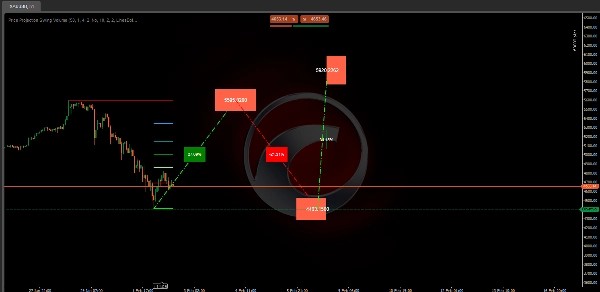
🟢 Como Interpretar Sinais e Visuais
https://chartshots.spotware.com/c/6980f126d875a
- Linhas Horizontais de Oscilação: As linhas grossas Vermelha (Alta) e Verde (Baixa) representam os limites atuais do mercado. A quebra desses preços frequentemente sinaliza uma mudança de tendência.
- O Caminho da Projeção (Linhas Pontilhadas): As linhas diagonais preveem um movimento "ziguezague". Esta é a previsão do algoritmo de como o preço pode se mover para alcançar seu alvo final.
- Rótulos Percentuais: Localizados nas linhas diagonais, mostram o ganho ou perda % esperado para aquele segmento específico do movimento.
- Caixas de Preço Alvo: As caixas coloridas no final de cada segmento fornecem o nível exato de preço que o algoritmo está mirando.
⚙️ Configurações e Parâmetros Principais
- Período de Retrospectiva (50): Determina a escala das oscilações. Um número maior busca oscilações "Macro", enquanto um número menor foca em oscilações "Micro" para scalping.
- Razão de Projeção (0.618): Esta "Razão Áurea" determina a profundidade e altura dos ziguezagues projetados. Você pode ajustar para alvos mais ou menos agressivos.
- Personalização Visual: Cores totalmente ajustáveis para projeções de alta/baixa e níveis específicos de Fibonacci para combinar com o tema do seu gráfico.
🚀 Casos e Cenários Típicos de Uso
- Definição de Alvo: Use as caixas de preço projetadas para definir níveis de Take Profit para operações de swing.
- Antecipando Reversões: Se a projeção mostrar uma retração profunda antes de um movimento para cima, os traders podem esperar o preço atingir a linha pontilhada "vale" antes de entrar.
- Movimentos Medidos: Excelente para traders que seguem padrões "ABCD" ou ação de preço harmônica.
👤 Perfil do Trader Alvo
- Traders de Swing e Tendência: Ideal para quem mantém posições por vários dias e precisa de um roteiro de potenciais resistências.
- Traders Harmônicos: Perfeito para usuários que dependem das razões de Fibonacci mas querem que a matemática seja feita automaticamente.
- Nível de Experiência: Intermediário. Os traders devem entender que estas são projeções e devem ser usadas junto com outras confirmações.
⚠️ Limitações Importantes e Notas de Uso
- Atualização Dinâmica: As projeções e níveis de oscilação "deslocam-se" em tempo real se uma nova Alta ou Baixa for criada dentro da janela de retrospectiva.
- Inicialização: O indicador precisa de uma quantidade mínima de histórico (igual ao Período de Retrospectiva) antes de começar a plotar com precisão.
Resumo
The indicator visually displays horizontal swing boundary lines (red for highs, green for lows), dotted diagonal projection lines with percentage gain or loss labels, and target price boxes indicating exact projected price levels. These features help traders set take profit targets, anticipate retracements or reversals, and identify measured moves consistent with harmonic patterns.
Key customizable settings include the lookback period for swing scale, projection ratio for target aggressiveness, and visual color options for bullish/bearish projections and Fibonacci levels. The indicator updates dynamically as new highs or lows form within the lookback window and requires sufficient historical data to initialize.
Price Projection Swing Volume supports multiple markets including BTCUSD, EURUSD, GBPUSD, NZDUSD, XAUUSD, NAS100, and USDJPY, making it suitable for traders using Fibonacci-based harmonic strategies and swing trading approaches.