
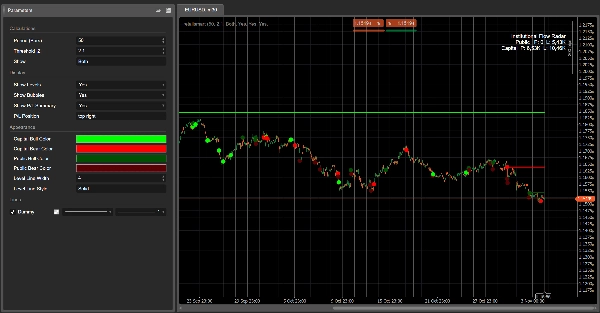
Institutional Flow Radar
Indicador
3 compras
Versão 1.0, Nov 2025
Windows, Mac
4.3
Avaliações: 3
Descrição
Radar de Fluxo Institucional – Descrição
Conceito:
O Radar de Fluxo Institucional escaneia o gráfico em busca de eventos de volume anormais e os classifica em dois grupos:
- Capital → atividade atribuída a participantes mais fortes / mais informados
- Público → atividade atribuída ao público em geral
Em seguida:
- desenha níveis horizontais nesses eventos,
- marca os eventos mais relevantes com bolhas coloridas,
- e mostra um resumo de P/L comparando quanto volume de Capital vs Público está atualmente em lucro ou prejuízo.
De relance, você vê onde grandes volumes atingiram a fita, quem está ganhando, e quais preços ainda estão se mantendo.
Como funciona (versão curta)
- Para cada barra, o algoritmo calcula um Z-score de volume sobre as últimas N barras (Período).
- Se o valor absoluto do Z-score estiver acima do seu Limite |Z|, essa barra é marcada como um evento de volume.
- A estrutura da vela (corpo vs alcance total) é usada para classificar o evento:
-
- corpo menor, pavios longos → Capital (absorção / comportamento mais complexo)
- corpo maior, movimento direcional → Público (ruptura estilo multidão / perseguição)
- Um nível horizontal é desenhado no preço do evento e mantido até que o preço negocie claramente através desse nível (mitigação).
- Para cada nível ativo, o Radar verifica se o preço atual está:
-
- em lucro para aquele lado (o preço se moveu na direção do evento), ou
- em prejuízo (o preço se moveu contra ele).
- A caixa de resumo P/L agrega os volumes de todos os níveis ativos:
-
- Lucro do Capital vs Prejuízo do Capital
- Lucro do Público vs Prejuízo do Público
Elementos visuais
- Níveis de Capital:
-
- Eventos de alta → nível de Capital altista (ex. verde brilhante / aqua)
- Eventos de baixa → nível de Capital baixista (ex. vermelho brilhante)
- Níveis do Público:
-
- Eventos de alta → nível de Público altista (tom acinzentado)
- Eventos de baixa → nível de Público baixista (cinza mais escuro / carvão)
- Bolhas:
-
- Círculos nos eventos mais significativos, coloridos por:
-
- direção (altista/baixista)
- classe (Capital / Público)
- Caixa de Resumo P/L:
-
- Linhas: Público, Capital
- Colunas: Lucro, Prejuízo
- A intensidade do fundo da célula aumenta com o volume correspondente.
Rótulos sugeridos para parâmetros (Inglês)
- Período (Barras): número de barras usadas para calcular o Z-score de volume.
- Limite |Z|: Z-score absoluto mínimo para marcar um evento.
- Mostrar:
Capital,Público, ouAmbos– qual classe exibir. - Mostrar Níveis / Mostrar Bolhas / Mostrar Resumo P/L
- Cor Bull do Capital / Cor Bear do Capital
- Cor Bull do Público / Cor Bear do Público
- Largura Média da Linha / Estilo Médio da Linha
Resumo
Resumo de IA
Institutional Flow Radar is a trading indicator that identifies and classifies abnormal volume events on price charts into two categories: Capital (activity from stronger or more informed participants) and Public (activity from the broader crowd). It calculates a volume Z-score for each bar over a specified period and flags bars exceeding a set threshold as volume events. These events are further classified based on candle structure—smaller bodies with long wicks indicate Capital activity, while larger bodies with directional moves indicate Public activity.
The indicator visually marks these events by drawing horizontal levels at event prices, which remain until price moves decisively through them. Significant events are highlighted with colored bubbles indicating direction (bullish or bearish) and classification (Capital or Public). A P/L summary box aggregates volume at active levels, showing Capital and Public volumes currently in profit or loss.
Users can customize parameters such as the period for Z-score calculation, threshold for event detection, and visual settings including colors for bullish and bearish levels for both Capital and Public groups. This tool provides a consolidated view of where large volume occurred, which participant group is prevailing, and which price levels are holding, aiding in volume-based breakout analysis.
Perfil do indicador
Avaliações de clientes
4.3
Avaliações: 3
5 | 33 % | |
4 | 67 % | |
3 | 0 % | |
2 | 0 % | |
1 | 0 % |
Avaliações de clientes
November 18, 2025
The only reason it stays interesting is the trading notes stop feeling so random, and two sessions say more than one clean chart.
November 9, 2025
Conversa
Perguntas frequentes
Breakout
Os produtos disponíveis através da cTrader Store, incluindo bots de negociação, indicadores e plugins, são fornecidos por programadores terceiros e são disponibilizados apenas para fins informativos e de acesso técnico. A cTrader Store não é um corretor e não fornece aconselhamento em matéria de investimento, recomendações pessoais ou qualquer garantia de desempenho no futuro.


Preço
42.11M
Volume negociado
6.13M
Pips ganhos
222
Vendas
8.39K
Instalações gratuitas