
Fixed Range Volume Profile
Indicador
2 compras
Versão 1.0, Jan 2026
Windows, Mac
4.0
Avaliações: 2
Descrição
Como Usar o Perfil de Volume de Faixa Fixa (FRVP)
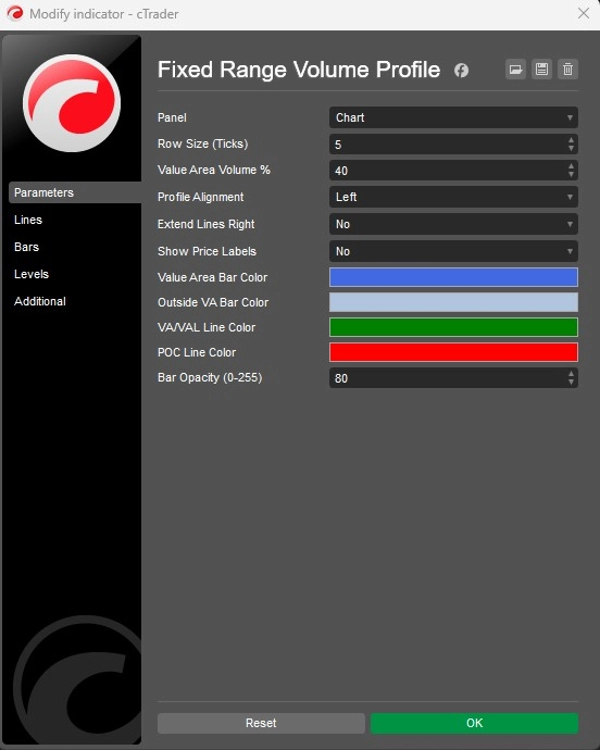
- Ativar o Indicador: Arraste e solte o Indicador FRVP no gráfico desejado a partir do menu cTrader Automate ou Indicadores.
- Selecionar a Ferramenta de Análise: Localize a Ferramenta de Desenho de Retângulo padrão na barra de ferramentas do cTrader (normalmente no lado direito ou esquerdo da plataforma).
- Definir Sua Faixa: Clique e arraste o retângulo sobre a ação de preço e o período de tempo específicos que deseja analisar.
- Inicializar o Perfil: Após desenhar, clique e mova o retângulo ligeiramente. Este "aperto de mão" entre o desenho e o indicador dispara o cálculo do volume, gerando instantaneamente o histograma, POC e as linhas da Área de Valor.
- Ajustar Dinamicamente: Você pode arrastar as bordas do retângulo para expandir o intervalo de tempo ou movê-lo para uma perna de preço diferente; o perfil de volume será recalculado automaticamente para refletir a nova área.
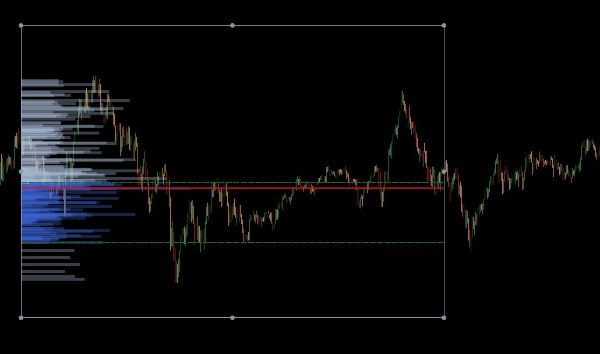
O Perfil de Volume de Faixa Fixa (FRVP) para cTrader é uma ferramenta de análise sofisticada projetada para identificar níveis significativos de preço calculando a distribuição de volume sobre um intervalo específico de tempo e preço. Ao contrário dos indicadores de volume padrão que correspondem ao tempo, este indicador foca na densidade de preço para revelar o sentimento do mercado.
Características Principais
- Seleção Dinâmica de Faixa: O indicador calcula e atualiza automaticamente sempre que você desenha ou move um retângulo padrão no seu gráfico cTrader.
- Identificação de Níveis-Chave:
-
- Ponto de Controle (POC): Destaca o nível de preço com o maior volume negociado, atuando como um "ímã" para a ação de preço.
- Alta/Baixa da Área de Valor (VAH/VAL): Define os limites onde uma porcentagem específica do volume (padrão 40%) foi negociada.
- Layouts Personalizáveis:
-
- Alinhamento: Escolha exibir o histograma de volume do Lado Esquerdo ou Lado Direito da caixa.
- Granularidade: Ajuste o Tamanho da Linha (padrão 5 ticks) para controlar o detalhe das barras de volume.
- Visuais: Controle total sobre as cores das barras (Área de Valor vs. Fora), opacidade e visibilidade do rótulo de preço.
Aplicação Estratégica
- Suporte e Resistência: Nós de Alto Volume (HVN) frequentemente atuam como suporte ou resistência fortes, enquanto Nós de Baixo Volume (LVN) representam áreas "finas" onde o preço pode se mover rapidamente.
- Confirmação de Tendência: Use o recurso Estender para a Direita para ver como os níveis históricos de volume interagem com a ação de preço atual conforme ela se desenvolve.
Resumo
Resumo de IA
The Fixed Range Volume Profile (FRVP) indicator for cTrader analyzes volume distribution within a user-defined price and time range using a standard rectangle drawing tool. By selecting and adjusting this rectangle on the chart, the indicator dynamically calculates and displays a volume histogram along with key levels: Point of Control (POC), which marks the price with the highest traded volume, and Value Area High/Low (VAH/VAL), defining the volume concentration boundaries. Users can customize the histogram’s alignment, granularity (row size), colors, opacity, and price label visibility. The indicator supports dynamic range adjustments by dragging the rectangle edges, automatically recalculating volume data. Strategically, it helps identify support and resistance zones through high and low volume nodes and offers trend confirmation by extending volume levels into current price action. The FRVP is applicable across various markets including Forex, cryptocurrencies, commodities, indices, and stocks, and supports symbols such as BTCUSD, EURUSD, GBPUSD, XAUUSD, and NAS100. It integrates with cTrader’s drawing tools and provides a detailed volume-based perspective on price action beyond standard time-based volume indicators.
Perfil do indicador
Avaliações de clientes
4.0
Avaliações: 2
5 | 0 % | |
4 | 100 % | |
3 | 0 % | |
2 | 0 % | |
1 | 0 % |
Conversa
Perguntas frequentes
BTCUSD
Forex
Signal
Breakout
Indices
EURUSD
Commodities
GBPUSD
NZDUSD
Fibonacci
Prop
Scalping
Fair Value Gap
SMC
Crypto
Stocks
XAUUSD
NAS100
USDJPY
VWAP
Os produtos disponíveis através da cTrader Store, incluindo bots de negociação, indicadores e plugins, são fornecidos por programadores terceiros e são disponibilizados apenas para fins informativos e de acesso técnico. A cTrader Store não é um corretor e não fornece aconselhamento em matéria de investimento, recomendações pessoais ou qualquer garantia de desempenho no futuro.


Preço
Desde 26/09/2025
14
Vendas