
RT Qualitative Quantity Estimation
Indicador
1 compras
Versão 1.0, Sep 2024
Windows, Mac
Descrição
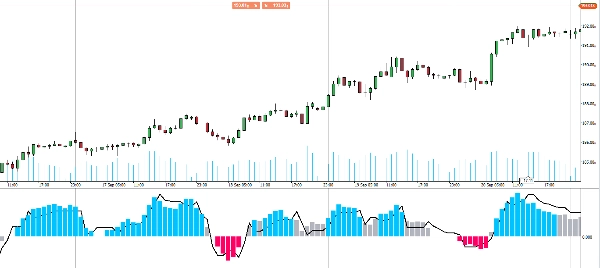
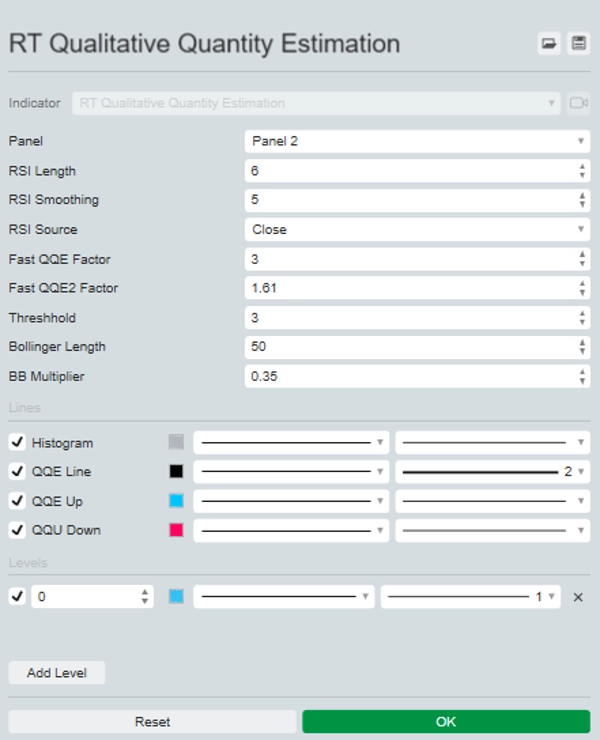
Apresentando o avançado indicador QQE (Estimativa Qualitativa Quantitativa), uma ferramenta poderosa que combina dois indicadores QQE para insights aprimorados de negociação.
Um QQE é exibido no gráfico como colunas, enquanto o outro opera em segundo plano com uma Banda de Bollinger de 50 períodos atuando como linha zero.
Esta configuração permite que você avalie visualmente o momentum do mercado e identifique pontos potenciais de entrada com clareza. Quando ambos os indicadores QQE se alinham, você verá barras claras azuis ou vermelhas, sinalizando fortes oportunidades de compra ou venda.
Eleve sua estratégia de negociação com o indicador QQE para decisões mais informadas e maior precisão na sua análise de mercado.
Resumo
Perfil do indicador
Avaliações de clientes
0.0
Avaliações: 0
Avaliações de clientes
Ainda não há avaliações para este produto. Já o experimentou? Seja o primeiro a contar a outras pessoas!
Conversa
Perguntas frequentes
BTCUSD
Forex
Signal
Indices
EURUSD
Commodities
GBPUSD
NZDUSD
Crypto
Stocks
XAUUSD
NAS100
USDJPY
Os produtos disponíveis através da cTrader Store, incluindo bots de negociação, indicadores e plugins, são fornecidos por programadores terceiros e são disponibilizados apenas para fins informativos e de acesso técnico. A cTrader Store não é um corretor e não fornece aconselhamento em matéria de investimento, recomendações pessoais ou qualquer garantia de desempenho no futuro.


Preço
Desde 25/09/2024
20
Vendas