
(ViPi) MTF Candles
Wskaźnik
106 pobrania
Wersja 1.0, Feb 2026
Windows, Mac
Opis
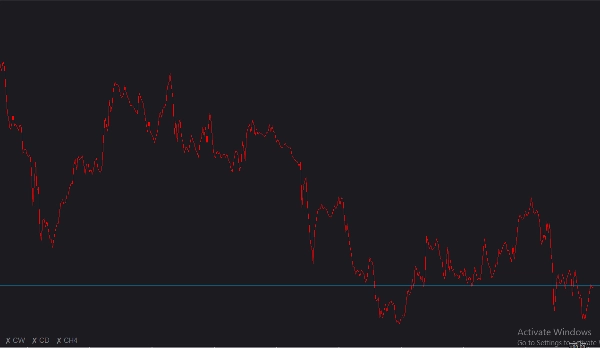
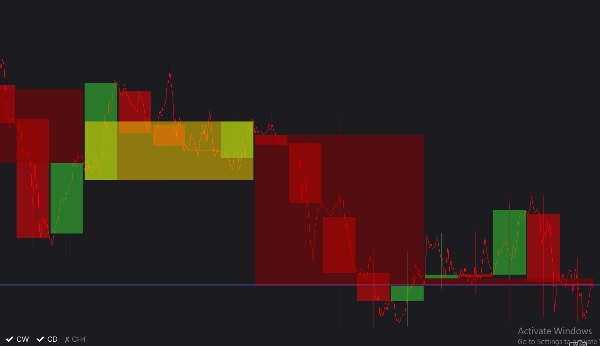
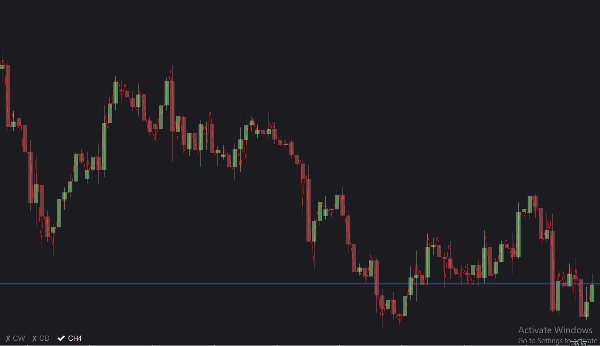
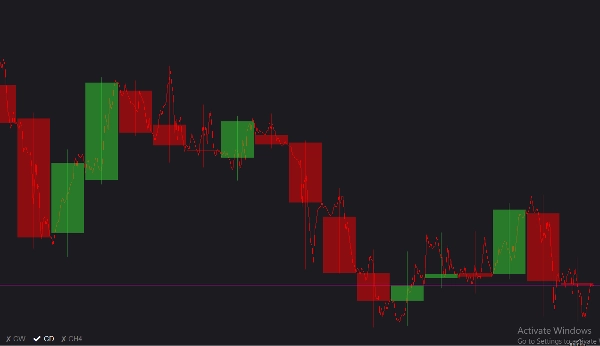
Szczegółowe wprowadzenie (ViPi) Świece MTF to wysoce interaktywne, konfigurowalne narzędzie do tworzenia wykresów, zaprojektowane tak, aby dać traderom perspektywę rynku z góry, bez konieczności opuszczania aktywnego wykresu. Poprzez bezproblemowe nakładanie do trzech różnych świec z wyższych interwałów czasowych (MTF) bezpośrednio na bieżący widok, możesz łatwo dostrzec trendy makroekonomiczne, kluczowe poziomy wsparcia/oporu oraz zmiany na rynku na pierwszy rzut oka. Posiada eleganckie, nieinwazyjne menu przełączników na wykresie, które pozwala natychmiast ukryć lub pokazać każdy interwał czasowy, zapewniając czystość i skupienie twojej przestrzeni roboczej.
Pełna lista parametrów
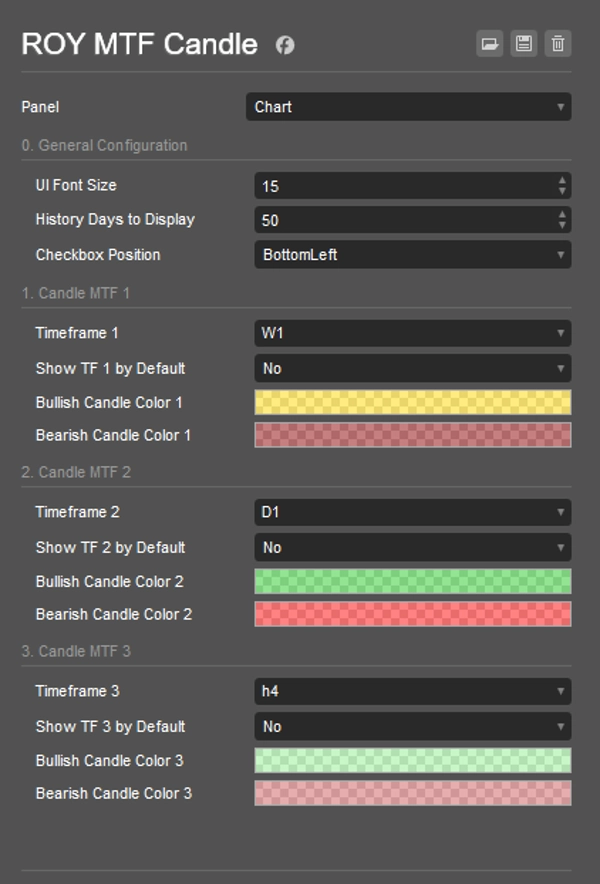
- Rozmiar czcionki UI: Dostosowuje rozmiar tekstu dla interaktywnych przycisków przełączających na wykresie. Można ustawić w zakresie od 8 do 30 (Domyślnie: 11).
- Liczba dni historii do wyświetlenia: Określa, ile dni wstecz wskaźnik będzie rysował historyczne świece MTF (Domyślnie: 50 dni).
- Pozycja pola wyboru: Pozwala przypiąć menu przełączników UI do dowolnego rogu wykresu: LewyGórny, PrawyGórny, LewyDolny lub PrawyDolny (Domyślnie: LewyDolny).
- Interwał czasowy 1, 2, 3: Konkretne wyższe interwały czasowe, które chcesz monitorować. (Domyślnie odpowiednio Tygodniowy, Dzienny i 4-godzinny).
- Pokaż TF 1, 2, 3 domyślnie: Przełącza, czy świece każdego interwału są widoczne od razu po zastosowaniu wskaźnika na wykresie (Domyślnie: Fałsz).
- Kolory świec byczych/niedźwiedzich: Umożliwia pełną personalizację kolorów świec wzrostowych i spadkowych dla każdego z trzech interwałów, z obsługą przezroczystości, aby nie zasłaniać głównego wykresu.
Przewodnik użytkowania
- Dołącz do wykresu: Załaduj wskaźnik (ViPi) Świece MTF do swojej aktywnej przestrzeni roboczej cTrader.
- Skonfiguruj interwały czasowe: Otwórz ustawienia i wybierz do trzech makro interwałów czasowych (np. Tygodniowy, Dzienny i H4), które chcesz monitorować obok bieżącego interwału.
- Dostosuj wygląd: Dostosuj kolory i przezroczystość świec byczych i niedźwiedzich dla każdego interwału, aby dobrze kontrastowały z tłem.
- Przełączaj widoczność na bieżąco: Użyj wygodnych interaktywnych przycisków na wykresie (znajdujących się w wybranej przez Ciebie pozycji pola wyboru), aby szybko kliknąć i włączać lub wyłączać konkretne nakładki MTF podczas analizy.
Podsumowanie
Podsumowanie AI
(ViPi) MTF Candles is a charting indicator for cTrader that overlays up to three higher timeframe (multi-timeframe, MTF) candlestick charts directly onto the current chart. This tool enables traders to analyze broader market trends, key support and resistance levels, and shifts in market sentiment without switching charts. Users can customize the displayed timeframes—commonly Weekly, Daily, and 4-hour—and adjust the number of historical days shown. The indicator includes an on-chart toggle menu, which can be positioned in any corner of the chart, allowing quick visibility control of each timeframe overlay. Visual customization options include adjustable font sizes for toggle buttons and configurable bullish/bearish candle colors with transparency settings to maintain chart clarity. This facilitates a streamlined, interactive top-down market perspective suitable for various markets including Forex, indices, commodities, stocks, and cryptocurrencies.
Profil wskaźnika
Opinie klientów
0.0
Opinie: 0
Opinie klientów
Ten produkt nie ma jeszcze opinii. Wypróbowałeś(-aś) go już? Bądź pierwszy(-a) i powiedz o tym innym!
Dyskusja
Częste pytania
BTCUSD
Forex
Indices
EURUSD
Commodities
GBPUSD
NZDUSD
Crypto
Stocks
XAUUSD
NAS100
USDJPY
Produkty dostępne za pośrednictwem cTrader Store, w tym boty handlowe, wskaźniki i wtyczki, dostarczane są przez deweloperów zewnętrznych i udostępniane wyłącznie w celach informacyjnych oraz w celu zapewnienia dostępu technicznego. cTrader Store nie jest brokerem i nie zapewnia doradztwa inwestycyjnego, nie udziela spersonalizowanych rekomendacji ani nie gwarantuje przyszłych wyników.
Więcej od tego autora


Cena
Od 12/06/2025
1
Sprzedaż
336
Bezpłatne instalacje