Opis
🚀 Ponad 10 000 traderów już korzysta z naszych NAJLEPSZYCH wskaźników🏆
👉 Zdobądź wszystkie nasze NAJLEPSZE systemy tutaj:
_______________________________________________
📌 Wskaźniki struktury rynku
· ✅ AdvancedMarket Structure: Bos, Choch, SwinLevels, Order Blocks, Market Structure& Liquidity Finder
· 🔄 Dynamic Market StructureAnalysis of Turning Points
· 🧱 Order Block
· ⚖️ Market Imbalance
· ⛓️ BOS & CHOCH
· 🧠 ICT Power of 3
_______________________________________________
🔚 Inteligentne systemy wyjścia
_______________________________________________
📐 Wskaźniki ZigZag
· 🔍 ZigZag Price LiquidityProjection
· ➖ ZigZag
_______________________________________________
🧱 Wskaźniki wsparcia i oporu
· 🟩 SmartTrend Support &Resistance Lines
· 🧱 All Support and ResistanceLevels
_______________________________________________
📊 Wskaźniki trendu i kanału
· 📊 Supertrend
_______________________________________________
💧 Narzędzia wolumenu i płynności
_______________________________________________
⚡ Wskaźniki momentum i RSI
· 🔎 Multi-Level Candle Bias
Tracker
_______________________________________________
🔮 Narzędzia prognozowania i projekcji
· 📐 Prediction Based on Linreg& ATR
· 📏 Fibonacci Linear RegressionMulti-timeframe
· 📈 Volume-Powered Market Flow Projector
Auto Supply and Demand: 💹
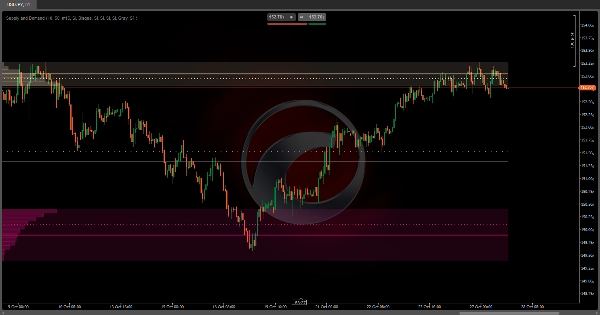
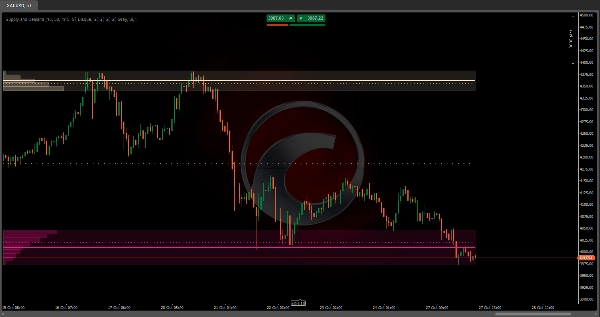
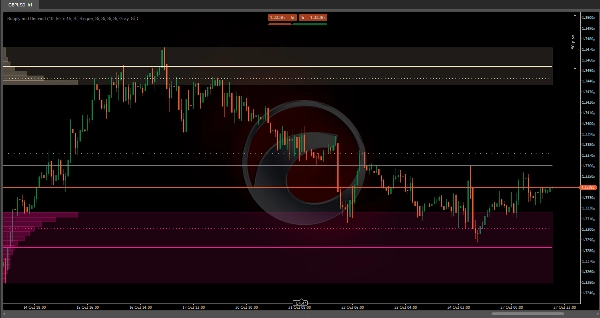
Auto Supply and Demand to zaawansowany wskaźnik analizy wolumenu, który automatycznie identyfikuje strefy najwyższej aktywności handlowej na Twoim wykresie. 📊 W przeciwieństwie do innych statycznych wskaźników, ten dynamicznie dostosowuje się do obserwowanego zakresu wizualnego, przeliczając strefy za każdym razem, gdy powiększasz lub przewijasz wykres.
Jak to działa? ❓
Algorytm dzieli widoczny zakres cenowy na wiele poziomów poziomych (konfigurowalnych od 2 do 500 podziałów) i analizuje wolumen obrotu na każdym poziomie. Aby osiągnąć większą precyzję, wykorzystuje dane z niższego interwału czasowego niż ten, który obserwujesz. 🕒 Na przykład, jeśli patrzysz na wykres godzinowy, może analizować świece 15-minutowe, aby dokładniej wykryć, gdzie faktycznie skoncentrowany był wolumen.
Proces identyfikacji 🔍
Wskaźnik działa od ekstremów w kierunku środka:
- Od najwyższej ceny: 🚀 Zaczyna od maksimum widocznego zakresu i schodzi poziom po poziomie, kumulując wolumen obrotu w każdym przedziale cenowym.
- Od najniższej ceny: 📉 Jednocześnie wznosi się od minimum, kumulując wolumen w kierunku wznoszącym.
- Próg aktywacji: ⚡ Gdy któraś ze stref zgromadzi określony procent całkowitego wolumenu (konfigurowalny, domyślnie 10%), jest oznaczana jako strefa istotna i wyszukiwanie w tym kierunku zostaje zatrzymane.
- Strefa środkowa: ⚖️ Po zidentyfikowaniu obu stref (górnej i dolnej), przestrzeń pośrednia jest oznaczana jako strefa neutralna lub równowagi.
Do czego to służy? 🎯
Ten wskaźnik to narzędzie analizy struktury rynku, które pomaga Ci:
- Zidentyfikować strefy podaży: 🏔️ Górne obszary, gdzie historycznie występowała wysoka aktywność sprzedaży.
- Zidentyfikować strefy popytu: 🏖️ Dolne obszary, gdzie skoncentrowana była aktywność kupujących.
- Wykryć strefy równowagi: 🎭 Środkowy zakres, gdzie siły kupujących i sprzedających się równoważą.
Te strefy mają tendencję do przyciągania ceny w przyszłości, ponieważ reprezentują poziomy, na których wielu uczestników zajmowało pozycje. 🧲
Jak można to łączyć? 🔗
Ze strategiami price action:
- Czekaj na testy ponowne zidentyfikowanych stref, aby szukać potwierdzeń odwrócenia.
- Używaj stref jako celów realizacji zysków lub miejsc ustawienia stop-loss.
Z wskaźnikami trendu:
- W trendzie wzrostowym, szukaj wejść, gdy cena testuje dolną strefę popytu. 📈
- W trendzie spadkowym, używaj górnej strefy podaży jako oporu dla sprzedaży. 📉
Z analizą wielointerwałową:
- Identyfikuj strefy na wyższych interwałach czasowych i szukaj potwierdzeń na niższych interwałach.
- Strefy z wyższego interwału mogą zawierać wiele stref na niższych interwałach.
Z wskaźnikami momentum:
- Łącz z RSI lub Stochastic aby potwierdzić warunki wykupienia/wyprzedania w strefach.
- Divergencje w strefach podaży/popytu mogą sygnalizować potencjalne odwrócenia.
Konfigurowalna konfiguracja ⚙️
Wskaźnik pozwala na całkowite dostosowanie każdej strefy niezależnie:
- Aktywuj/dezaktywuj każdy element wizualny (obszary, linie średnie, linie ważone).
- Próg wolumenu: Jaki procent całkowitego wolumenu musi zostać zgromadzony, aby uznać strefę za istotną.
- Podziały cenowe: Większa liczba = większa precyzja, ale więcej obliczeń.
- Niższy interwał czasowy: Definiuje szczegółowość analizy wolumenu.
Kluczowa cecha: Automatyczna adaptacja 🔄
Automatyczne przeliczanie na podstawie Twojego widoku. Oznacza to, że:
- Jeśli przybliżysz aby zobaczyć szczegóły sesji, wskaźnik zidentyfikuje konkretne strefy podaży i popytu dla tych godzin.
- Jeśli oddalisz aby zobaczyć tygodnie lub miesiące, wskaźnik przeliczy makrostrefy dla całego okresu.
- Za każdym razem, gdy przewijasz wykres, strefy aktualizują się, aby odzwierciedlić kontekst widocznego zakresu.
Podsumowanie
The indicator divides the visible price range into configurable horizontal levels (2 to 500 divisions) and analyzes volume traded at each level using data from a lower timeframe than the chart’s timeframe for enhanced accuracy. It identifies significant zones by accumulating volume from the highest and lowest visible prices until a configurable volume threshold (default 10%) is reached, marking these as supply and demand zones respectively. The area between these zones is designated as a balance zone, representing equilibrium between buying and selling pressures.
These zones highlight areas of historically high trading activity that often act as future price magnets. The indicator supports customization of visual elements, volume thresholds, price divisions, and analysis timeframe. It can be combined with price action strategies, trend indicators, multiple timeframe analysis, and momentum indicators like RSI or Stochastic to improve trade entries, exits, and confirmations.
Supported markets include Forex, Indices, Commodities, Stocks, and Cryptocurrencies, with symbols such as EURUSD, GBPUSD, BTCUSD, XAUUSD, and NAS100.
Opinie klientów
5 | 50 % | |
4 | 0 % | |
3 | 0 % | |
2 | 0 % | |
1 | 50 % |