
Mô tả
Vice TrendTrading
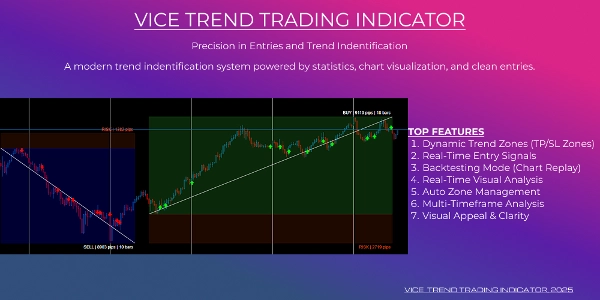
"Các Vùng Xu Hướng Nâng Cao & Mũi Tên Vào Lệnh Chính Xác Được Hỗ Trợ Bởi Logic Xu Hướng Đa Khung Thời Gian"
Đây không chỉ là một chỉ báo xu hướng khác — nó là một hệ thống giao dịch trực quan hoàn chỉnh được thiết kế để giúp bạn tìm xu hướng thị trường, theo dõi hiệu suất thị trường theo thời gian thực, và phân tích kết quả xu hướng một cách rõ ràng.
Công cụ tiên tiến này kết hợp phân tích xu hướng đa khung thời gian, lớp phủ lợi nhuận/thua lỗ theo thời gian thực, và mũi tên tín hiệu tự động thành một trải nghiệm biểu đồ sạch sẽ và mạnh mẽ.
Các Tính Năng Chính:
1. Vùng Xu Hướng Động (Hình Ảnh TP/SL)
Tóm tắt
Hồ sơ chỉ báo
Đánh giá của khách hàng
4.5
Đánh giá: 2
5 | 50 % | |
4 | 50 % | |
3 | 0 % | |
2 | 0 % | |
1 | 0 % |
Đánh giá của khách hàng
July 15, 2025
not perfect, but the workflow felt cleaner, and A small account test feels safer.
July 7, 2025
Not perfect, but the workflow felt cleaner. It needs a few bad trades in the sample too.
Thảo luận
Câu hỏi thường gặp
Các sản phẩm có sẵn trên cTrader Store, bao gồm bot giao dịch, chỉ báo và plugin, được cung cấp bởi các nhà phát triển bên thứ ba và chỉ nhằm mục đích cung cấp thông tin và tiếp cận kỹ thuật. cTrader Store không phải là nhà môi giới và không cung cấp lời khuyên đầu tư, khuyến nghị cá nhân hay bất kỳ đảm bảo nào về hiệu suất trong tương lai.


Giá
Kể từ 17/06/2025