
Descrição
RSI Personalizado – Reversões Spot com Precisão e Visuais Limpos
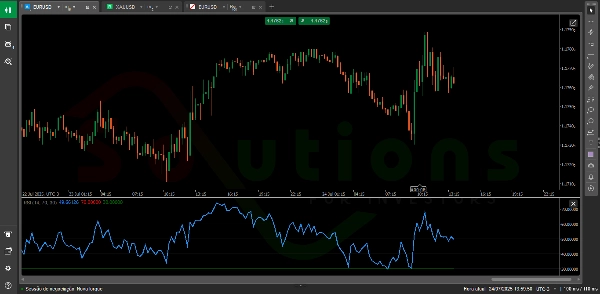
RSI Personalizado é uma versão aprimorada do clássico Índice de Força Relativa (RSI), projetado para ajudar os traders a identificar rapidamente zonas de sobrecompra e sobrevenda—áreas-chave onde o preço provavelmente irá reverter.
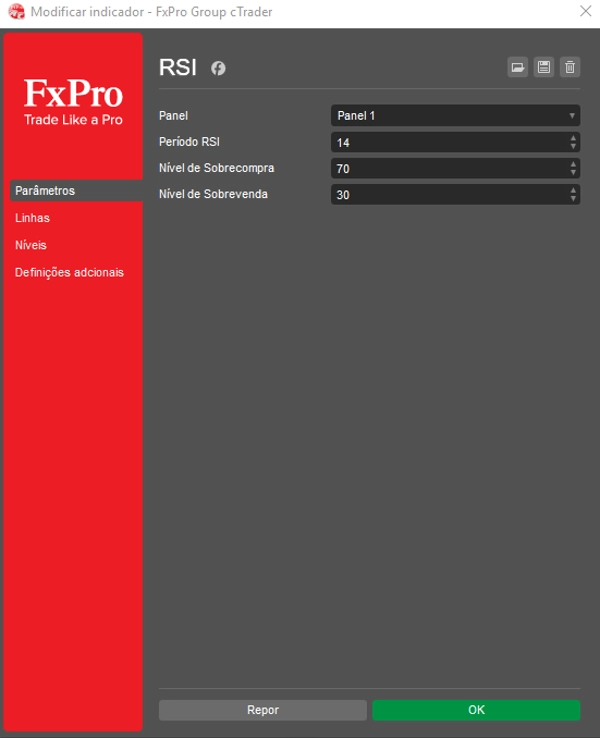
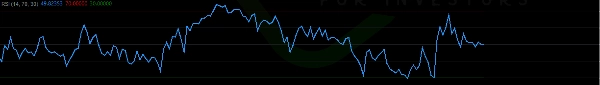
Com uma interface limpa e intuitiva, ele exibe duas linhas horizontais totalmente personalizáveis (como os níveis tradicionais 70 e 30), marcando claramente pontos de decisão de alta probabilidade no gráfico.
✅ Ajuste o período e os níveis do RSI para adequar ao seu estilo de negociação
✅ Identifique zonas potenciais de reversão com maior confiança
✅ Aprimore sua análise técnica com um indicador claro e sem confusão
Perfeito para traders de todos os níveis, RSI Personalizado transforma dados brutos de preço em insights inteligentes e acionáveis—tornando-se uma ferramenta essencial para decisões lucrativas.
Resumo
Avaliações de clientes
5 | 0 % | |
4 | 100 % | |
3 | 0 % | |
2 | 0 % | |
1 | 0 % |


