
VolumeRenkoRange
Indicador
1.4K transferências
Versão 1.1, Jan 2026
Windows, Mac
5.0
Avaliações: 1
Descrição
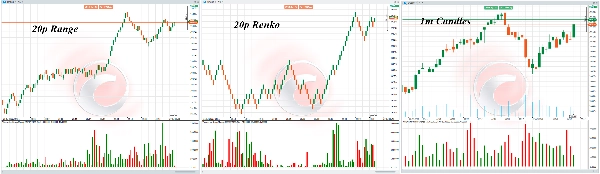
VolumeRenkoRange aplica a lógica de volume de ticks em gráficos baseados em preço.
Usa dados de ticks para calcular o volume, assim como as velas.
Isso é possível porque temos o horário de abertura/fechamento da barra, então:
Lógica de volume = Número de atualizações de preço (ticks) durante a formação da barra (entre o OpenTime e o CloseTime).
O que há de novo na rev.1?
Inclui todas as melhorias relacionadas ao "Order Flow Aggregated"
- VolumeTick() de alto desempenho
- Coleta assíncrona de dados de ticks
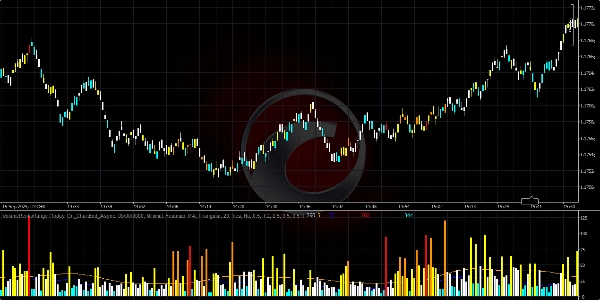
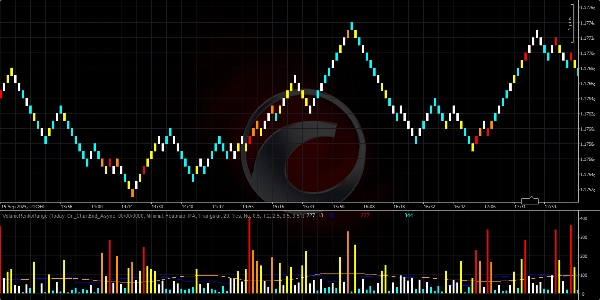
- Coloração Heatmap/Fading
Resumo
Resumo de IA
VolumeRenkoRange is an indicator designed for price-based charts such as Renko and Range charts. It applies tick volume logic by calculating the number of price updates (ticks) that occur during the formation of each bar, using the bar's open and close times. This approach enables volume measurement on non-time-based charts similarly to traditional candlestick charts. The indicator incorporates high-performance tick volume calculation, asynchronous tick data collection, and visual enhancements like heatmap and fading coloring to represent volume intensity. It is part of a suite of cTrader Store indicators focused on order flow and volume analysis.
Perfil do indicador
Avaliações de clientes
5.0
Avaliações: 1
5 | 100 % | |
4 | 0 % | |
3 | 0 % | |
2 | 0 % | |
1 | 0 % |
Avaliações de clientes
July 9, 2025
Pros: Displays volume-based Renko blocks, filtering noise and highlighting impulsive moves. Flexible settings, stable performance. Cons: No tooltips or alerts. No template saving. Requires additional confirmation tools for reliable trading decisions.
Conversa
Perguntas frequentes
VWAP
Os produtos disponíveis através da cTrader Store, incluindo bots de negociação, indicadores e plugins, são fornecidos por programadores terceiros e são disponibilizados apenas para fins informativos e de acesso técnico. A cTrader Store não é um corretor e não fornece aconselhamento em matéria de investimento, recomendações pessoais ou qualquer garantia de desempenho no futuro.


Também poderá gostar de


![Logótipo de "High-Low Divergence [Iridio Capital]"](https://cdn.ctrader.com/image/webp/443c4661-7abb-40f1-842f-4b6ec560649b_40914)
![Logótipo de "[Hamster-Coder] Pivot Points MTF"](https://cdn.ctrader.com/image/webp/4c143e5a-309c-40e3-a578-f04d1e133ffa_31159)


![Logótipo de "[Stellar Strategies] Market Session Ultimate"](https://cdn.ctrader.com/image/webp/61ffd537-0125-4246-9e72-42eca1791d64_28232)
Preço
Desde 12/12/2024
1
Vendas
33.13K
Instalações gratuitas