Descrizione
Indicatori Pinescriptlabs Store: Pinescriptlabs Store cBots : (cBot) Gold & BTC BreakoutSession Pivots(nuovo)
Proiezione della Liquidità del Prezzo ZigZag
Algoritmo Intelligente di Inseguimento (nuovo)
Mappa di Liquidazione della Leva
Previsione Basata su Linreg & ATR
Supporto SmartTrend &
Resistenza
Linee
Sistema di Breakout del Canale
Analisi
Dinamica
della Struttura
di Mercato
dei Punti
di Inversione
Regressione
Lineare
Fibonacci
Multi-timeframe
Proiezione del Flusso di Mercato
Gradiente di Tendenza Dinamico
Tracciatore
Bias Multi-Livello
Candele
Tracciatore di Estremi Zig-Zag
Supporto
e Resistenza
Trend
Linee
Tutti
i Supporti e
le Resistenze
Livelli
🌟 Ottimo lavoro del team per sviluppare questo indicatore Ctrader! Supportaci condividendo - miglioramenti visivi inclusa la barra di scorrimento orizzontale in arrivo!
⚠️ Nota Tecnica: Zoom/scorrimento manuale attualmente necessario per una visualizzazione ottimale ("Limitazione temporanea: funziona meglio su timeframe inferiori a 1H a causa delle limitazioni visive della piattaforma Ctrader")
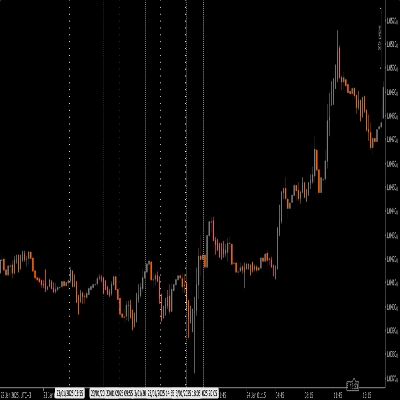
📊 Visualizzazione HTF in Tempo Reale
Questo algoritmo mostra le candele di timeframe superiori (1W, 1D, 4H, 1H) direttamente sul tuo grafico di trading, offrendoti una struttura di mercato completa a colpo d'occhio - senza bisogno di cambiare finestra!
🔍 Analisi Rapida
Individua le tendenze principali (direzione giornaliera/settimanale) mentre fai trading su timeframe inferiori
• Funzione Avanzata: le candele HTF si aggiornano in tempo reale - i cambiamenti di colore mostrano istantaneamente le variazioni di momentum
⚙️ Come Usare
• Attiva/disattiva singoli blocchi HTF
• Regola le candele visibili (1-10 per timeframe)
💡 Benefici Rivoluzionari
Ora puoi:
1️⃣ Anticipare la chiusura delle candele chiave
2️⃣ Rilevare inversioni di tendenza in diretta
3️⃣ Monitorare livelli chiave su più timeframe contemporaneamente
🚀 Miglioramenti in Arrivo
La barra di scorrimento orizzontale permetterà:
• Analisi storica dei pattern HTF
• Confronto tra struttura attuale e passata
• Identificazione di zone chiave su timeframe superiori
📚 Esempi Pratici
• Quando 1W = verde & 1D = rosso → Il mercato sta correggendo all’interno di una tendenza rialzista → Short solo ai rimbalzi su resistenze chiave
• Gerarchia della Tendenza: 1W > 1D > 4H > 1H → Sempre fare trading con la direzione della candela settimanale
• Ingressi di Confluenza:
- Prezzo al supporto 1D + candela verde 4H emergente = opportunità Long
- Resistenza al massimo 1H + candela rossa 4H = Short con stop sopra il massimo
• Pattern di Breakout: - Se la candela 1H rompe il massimo precedente prima della chiusura (timer attivo), aspettati una continuazione rialzista
Riepilogo
Users can toggle individual higher timeframe candle blocks on or off and adjust the number of visible candles per timeframe (1 to 10). This facilitates monitoring of key levels and trend directions across multiple timeframes simultaneously. Practical use cases include anticipating candle closings, detecting live trend reversals, and identifying confluence entries based on support, resistance, and candle color changes.
Due to platform visual constraints, manual zoom and scroll are currently required for optimal viewing, especially on timeframes below 1 hour. Planned updates will introduce horizontal scrolling to enable historical pattern analysis, comparison of current versus past structures, and identification of key zones on higher timeframes.
HTF Candles supports traders in aligning trades with higher timeframe trends and enhances multi-timeframe market analysis within a single chart view.