calculateSpreads_withSourceCode
Indicador
204 descargas
Versión 1.0, Mar 2025
Windows, Mac
5.0
Valoraciones: 1

Descripción
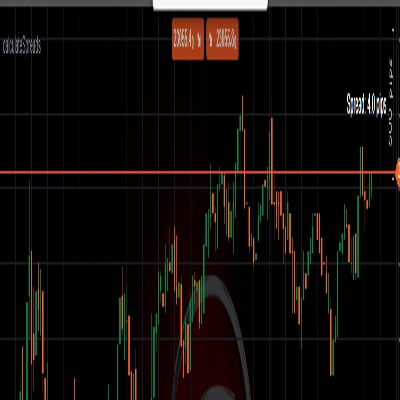
El indicador calcula el spread en pips
Resumen
Resumen de IA
This indicator calculates the spread in pips for trading instruments. It provides a numerical measure of the difference between bid and ask prices, expressed in pips, which is a standard unit in forex and other markets. The product includes source code, allowing users to review or modify the calculation logic. It is designed for integration within trading platforms to assist traders in monitoring spread values directly on their charts.
Perfil del indicador
Valoraciones de clientes
5.0
Valoraciones: 1
5 | 100 % | |
4 | 0 % | |
3 | 0 % | |
2 | 0 % | |
1 | 0 % |
Valoraciones de clientes
August 18, 2025
Real-time spread monitoring, customizable, open-source for modification. Cons: No history chart, no alerts, limited analytics.
Conversación
Preguntas frecuentes
Los productos disponibles a través de cTrader Store, incluidos bots, indicadores y plugins para operar, son proporcionados por desarrolladores de terceros y están disponibles únicamente con fines informativos y de acceso técnico. cTrader Store no es un bróker, por lo que no proporciona asesoramiento de inversión, recomendaciones personales ni ninguna garantía de rentabilidad futura.


Precio
Desde 27/02/2025
204
Instalaciones gratis