
説明
⚠️ 移転しました 👉 PrimeQuant
🚫🚫🚫 このインジケーターを購入しないでください!
⚡ 次世代バージョン利用可能: このクラシックなLudwigICTツールは再設計され、再構築され、新しい開発者ブランドPrimeQuantのもとで再リリースされました。新バージョンは洗練されたUIと現在の市場状況に合わせた更新されたプロパティを備えています。割引価格でアップグレード版をこちらで入手してください:
👉 PrimeQuantによるBreakout Channels
👉 PrimeQuantによるBreakout Channels
👉 PrimeQuantによるBreakout Channels
(ご注意:LudwigICTのリスティングはレガシーユーザー向けにアクティブなままですが、今後は更新や価格割引はありません。)
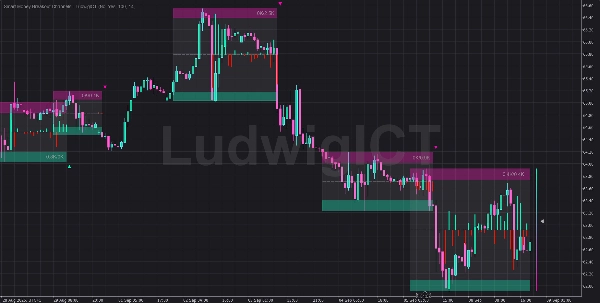
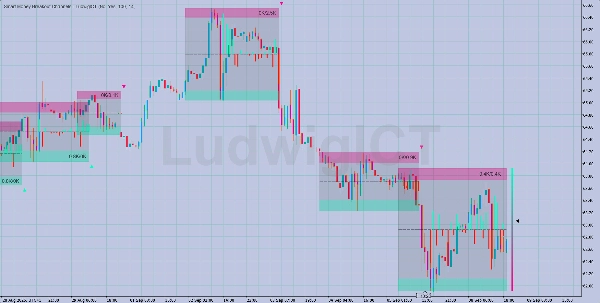
かつてないほどの高確率のブレイクアウトゾーンを発見しましょう。
このSmart Money Breakout Channelsインジケーターは、価格アクション、ボラティリティ、ボリューム分析を組み合わせ、cTrader向けの強力な可視化ツールを提供します。
🚀 主な特徴
- 自動ブレイクアウト検出 → 強気および弱気のチャネルゾーンを即座にハイライト。
- スマートチャネルボックス → 透明度付きの色分けでチャートをすっきり表示。
- ボリュームインテリジェンス → オーバーレイモード:生データ、買い対売り、またはデルタボリューム。
- 動的ミッドライントラッキング → 進化する市場構造に合わせて追従。
- ブレイクアウトシグナル → ▲ 強気 / ▼ 弱気の矢印が自動で表示。
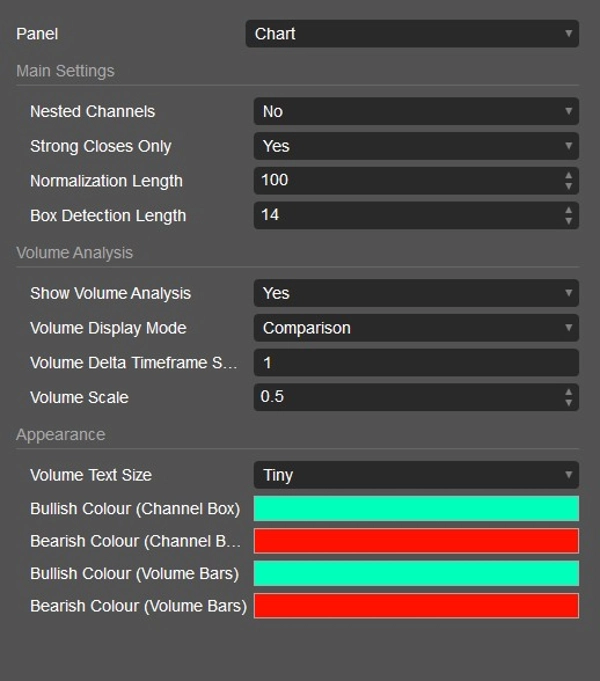
- 完全カスタマイズ可能 → 感度、色、ボリュームスケーリング、テキストサイズ。
- ネストされたチャネル → 重複構造を分析し、より深い洞察を提供。
- プロフェッショナルデザイン → どのズームレベルでも最適化されたビジュアル。
🎯 トレーダーが愛用する理由
- チャネルを手動で描くことなくブレイクアウトの機会を特定。
- 価格+ボリュームを組み合わせて、より鋭い取引判断を。
- 自動化された直感的な表示で時間を節約。
- Forex、指数、CFDでシームレスに機能。
✅ 最適な対象
- 日中取引、スイング、ポジショントレーダー。
- ボリュームに基づくブレイクアウト設定に依存するトレーダー。
- スマートマネーコンセプトのためのプロフェッショナルグレードの可視化ツールを求めるすべての人。
⚡ チャートに取り付けて、スタイルに合わせてカスタマイズし、Smart Money Breakout Channelsに最も重要なブレイクアウトゾーンを明らかにさせましょう。
ご質問や問題があれば、お気軽にご連絡ください。喜んでお手伝いします!
免責事項:
私のアルゴリズムを使用することで、取引には固有のリスクが伴い、過去のパフォーマンスが将来の結果を保証しないことを認識したものとみなされます。堅実なリスク管理戦略を持ち、何よりも損切りレベルを守る規律を維持することが不可欠です。リスク管理を怠ると重大な損失につながる可能性があります。これらのアルゴリズムの使用による財務結果について私は責任を負いません。責任を持って取引し、常に適切なリスク管理を実践してください。
祝福を! 🙌
概要
カスタマーレビュー
5 | 100 % | |
4 | 0 % | |
3 | 0 % | |
2 | 0 % | |
1 | 0 % |


