
说明
⚠️ 我们已迁移至 👉 PrimeQuant
🚫🚫🚫 请勿购买此指标!
⚡ 下一代版本现已推出: 这款经典的 LudwigICT 工具已重新设计、重构,并以我们新的开发者品牌 PrimeQuant 重新发布。新版本具有简化的用户界面和针对当前市场条件更新的属性。在此以折扣价获取升级版本:
👉 完整 ICT SMC 套件 - ADR AWR AMR OHLC Fibs EIS SR 警报
👉 完整 ICT SMC 套件 - ADR AWR AMR OHLC Fibs EIS SR 警报
👉 完整 ICT SMC 套件 - ADR AWR AMR OHLC Fibs EIS SR 警报
(请注意:LudwigICT 列表仍对遗留用户有效,但将不再接收更新或有效的价格折扣。)
🔥 高级 ICT + ADR + AWR 专业套件
停止猜测,开始以机构级的清晰度观察市场。由 LudwigICT 提供的 高级 ICT 专业套件 是一款专业级的全能图表工具包,专为有眼光的价格行为交易者设计。精心打造,成为传奇 Pine Script 指标的 稳定且视觉完美 复制品,该套件自动化了绘制关键市场结构的复杂任务,让您专注于真正重要的内容:策略和执行。
这不仅仅是另一个指标;它是观察市场的完整框架。通过无缝整合核心 ICT 概念中的 价格、时间、波动性和动量,该套件在您的 cTrader 图表上提供无与伦比的机构级金融市场视角。
为什么选择 LudwigICT 套件?
- 一体化强大工具: 这个单一指标替代了数十个独立工具。您将获得斐波那契分析、范围预测、多层市场结构、更高时间框架背景和动量着色,全部集成在一个轻量且高效的包中。
- 坚不可摧的稳定性为王: 您是否使用过水平线在滚动时跳动和重绘的指标?我们解决了这个问题。我们的专有 智能锚定 逻辑确保您的斐波那契水平锁定在重要的历史枢轴点上,提供一致且可靠的框架,仅在市场结构真正变化时才适应。
- 视觉完美与清晰: 我们相信交易者最宝贵的资产是专注力。该套件设计旨在增强清晰度,而非制造杂乱。元素简洁、不干扰且完全可定制。默认设置即开箱即用,适合专业使用。
- 为严肃交易者精确设计: 从 Elder Impulse 系统到平均日范围的每个计算都经过严格测试,与原始、可信的 Pine Script 逻辑完全匹配。无捷径,无近似。
关键功能说明
该套件由多个强大且独立的模块组成,您可以切换并自定义以适应您的具体交易风格。
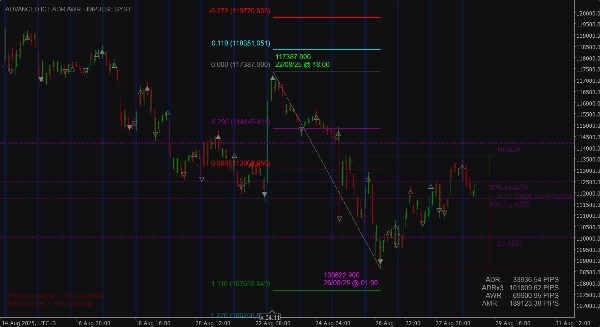
✔️ 稳定且锚定的斐波那契回撤(套件核心)
cTrader 上最稳定且智能的斐波那契工具。
- 智能锚定逻辑: 自动识别并锁定最后一个主要且重要的摆动高点和低点,为您的分析提供稳定且可靠的价格区间。
- 智能突破重置: 斐波那契水平保持锚定,直到价格决定性地收盘突破既定区间(突破距离完全可自定义)。这防止了在小幅回撤时绘图跳动,确保仅在市场结构真正变化时才调整。
- 标志性虚线趋势线: 标志性的虚线斜线连接您的斐波那契区间锚点,清晰地展示您分析的趋势。
- 可选 ZigZag 覆盖: 为了额外确认,您可以启用经典 ZigZag 覆盖,查看所有历史枢轴点的路径。默认关闭以保持图表整洁。
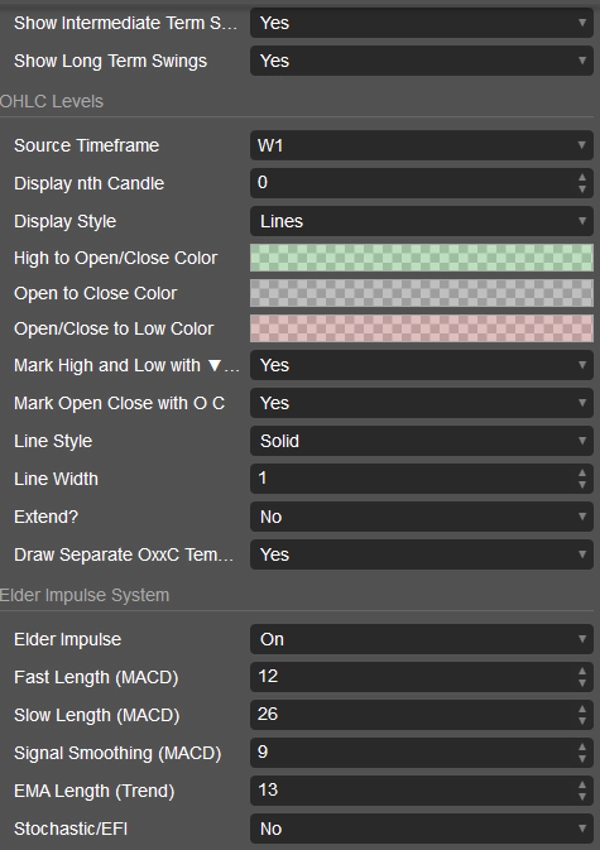
✔️ Elder Impulse 系统(动量柱着色)
即时评估市场的三重共识:趋势、动量和力量。
- 绿色柱: 表示看涨共识(13 EMA 上升且 MACD 直方图上升)。市场处于强劲上升趋势。
- 红色柱: 表示看跌共识(13 EMA 下降且 MACD 直方图下降)。市场处于强劲下降趋势。
- 蓝色柱: 表示中性状态或趋势与动量之间存在分歧。需谨慎。
- 柱边框: 一个细微但关键的特征。每根柱子周围绘制有色边框,显示其真实方向(看涨或看跌收盘),这对于当主色被覆盖时准确的蜡烛图分析至关重要。
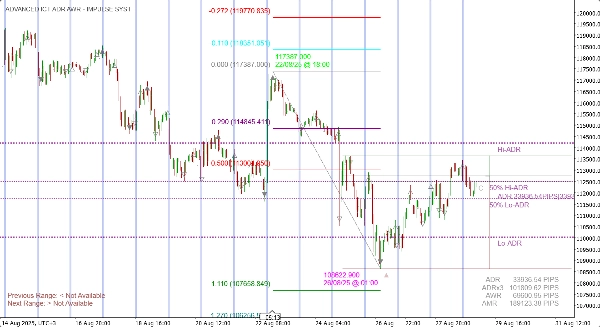
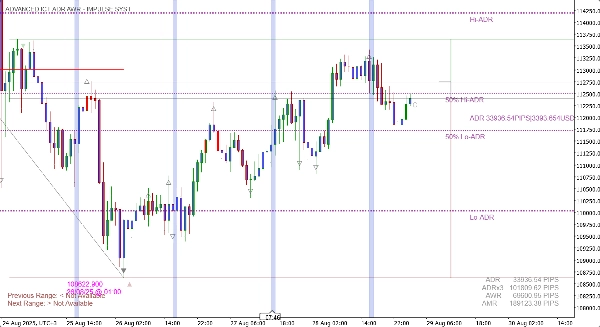
✔️ 高级范围预测(ADR、AWR、AMR)
了解您的工具边界,设定现实的日、周和月目标。
- 动态预测: 自动计算并绘制平均日范围、平均周范围和平均月范围。
- 预测高低点: 根据计算的范围查看预测的支撑和阻力水平。
- 50% 中点: 对识别平衡点和预测范围内潜在反转点至关重要。
- 屏幕数据表: 一个干净、可定制的表格显示所有关键范围值,以点数和/或货币形式,方便快速查看。
✔️ 多层市场结构(短期、中期、长期摆动)
停止手动绘制摆动点。指标为您完成。
- 自动识别: 直接在图表上绘制短期(ST)、中期(IT)和长期(LT)摆动高点和低点。
- 清晰符号: 使用简单直观的点和三角形系统表示市场结构的层级。
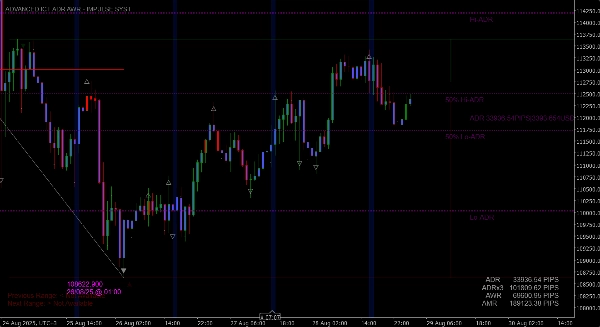
✔️ 更高时间框架 OHLC 水平
在不离开图表的情况下,使用多时间框架背景进行交易。
- 关键价格水平: 叠加任何更高时间框架(如周线、日线)的开盘、高点、低点和收盘,显示为干净的线条或阴影盒。
- 交易时段分析: 即时查看当前价格相对于前一天或前一周关键水平的位置。
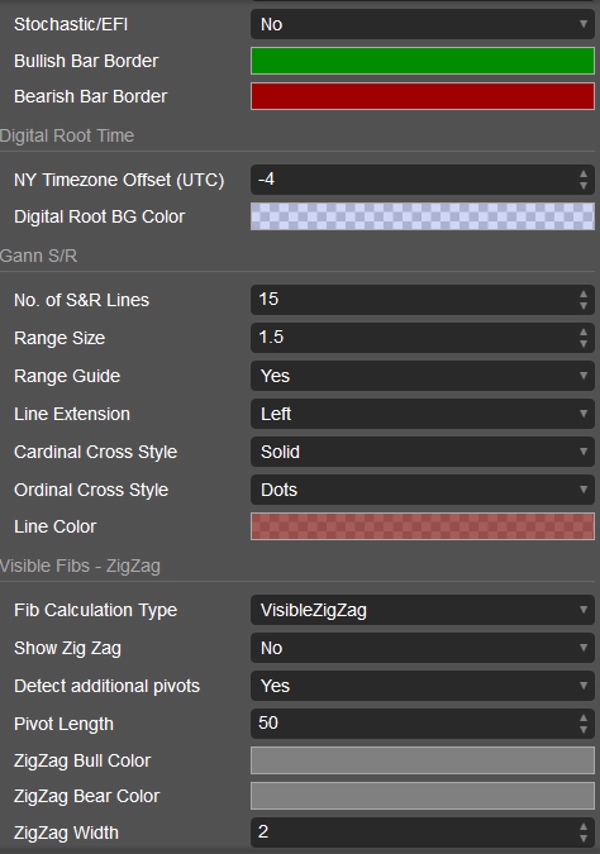
✔️ 动态支撑与阻力工具
- 甘恩支撑/阻力水平: 一套强大且数学推导的支撑和阻力线,能适应工具的波动性。
- 数字根时间: 以全高垂直条突出显示特定预定义时间窗口,随着平移和缩放动态调整大小,确保始终可见。
如何使用高级 ICT 专业套件
该套件是一个多功能工具包,而非简单的“买/卖”信号指标。以下是将其整合到交易中的几种方式:
- 高概率汇聚交易:
- 趋势确认与动量入场:
-
- 使用 市场结构 摆动点识别整体趋势(例如一系列更高的高点和更高的低点)。
- 在回撤期间,等待 Elder Impulse 颜色变为蓝色(中性)。
- 颜色一旦回转至趋势方向(上涨趋势为绿色,下跌趋势为红色)即入场交易。
- 区间与交易时段反转交易:
-
- 观察价格接近关键边界,如预测的 ADR 高点 或 前一日高点。
- 寻找疲软迹象,如价格未能收盘于该水平之上且 Elder Impulse 颜色变为蓝色或反转为相反颜色。
- 入场反转交易,目标为 50% ADR 水平或区间另一侧。
完整可自定义参数列表
(本节为客户提供产品灵活性的信心)
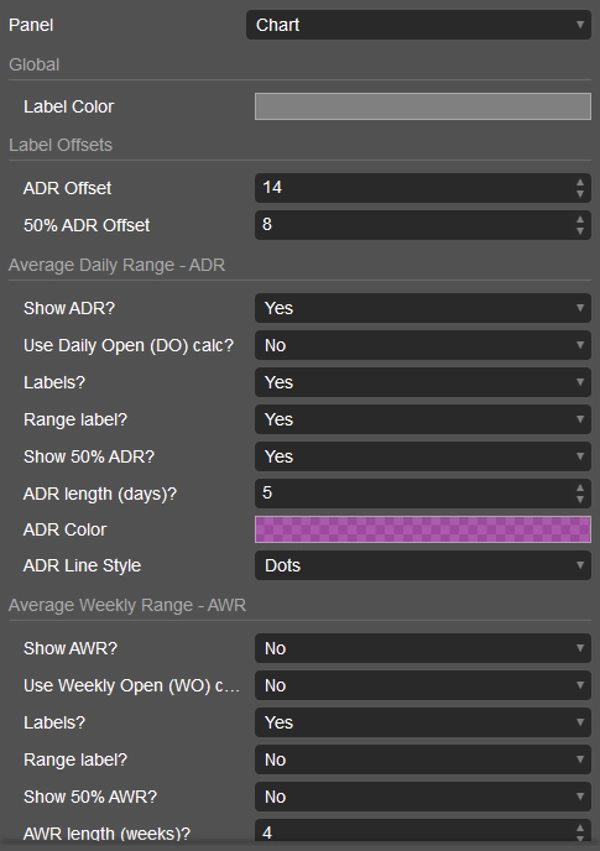
- 全局设置: 标签颜色,偏移量。
- 平均日范围(ADR): 开关,使用日开盘,显示标签,显示范围,显示 50% 水平,回溯周期,颜色,线条样式。
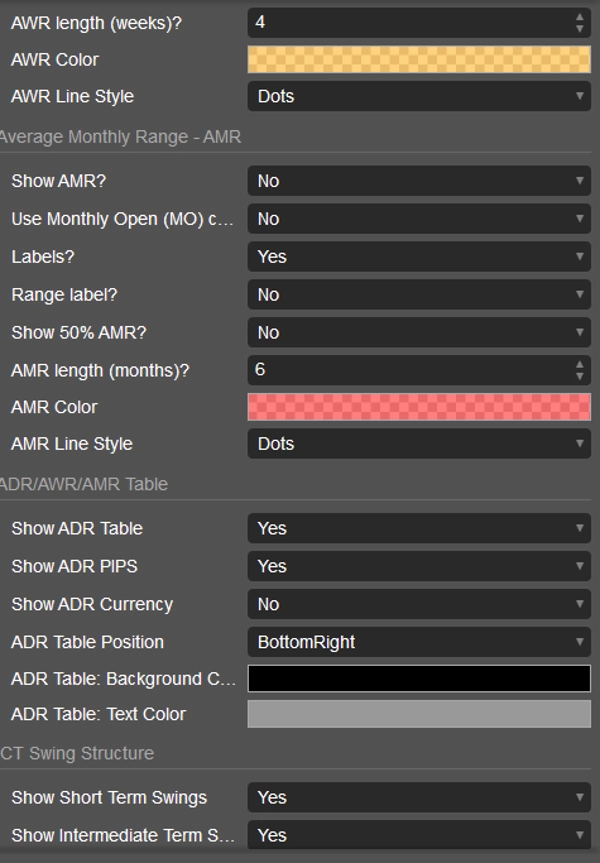
- 平均周范围(AWR): 完全可自定义设置,与 ADR 相同。
- 平均月范围(AMR): 完全可自定义设置,与 ADR 相同。
- 数据表: 开关,显示点数,显示货币,屏幕位置,颜色。
- ICT 市场结构: 独立切换短期、中期和长期摆动。
- OHLC 水平: 来源时间框架,蜡烛回溯,显示样式(线条/盒子),所有颜色,标记高低点,标记开收盘,延长线条,显示模板。
- Elder Impulse 系统: 开关,所有 MACD 和 EMA 参数,随机指标/EFI 模式,看涨/看跌柱边框颜色。
- 数字根时间: 纽约时区偏移,背景颜色。
- 甘恩支撑/阻力: 线条数量,范围大小,线条延伸,线条样式,颜色。
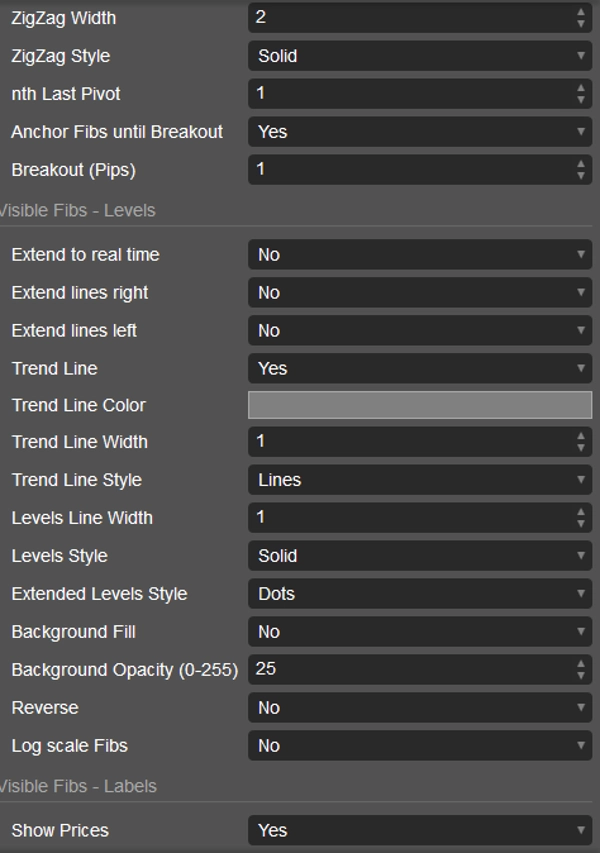
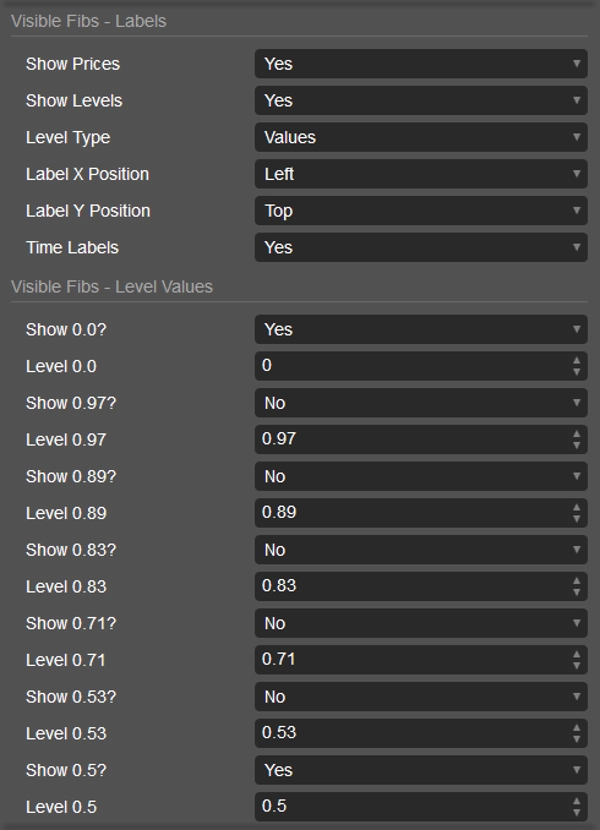
- 可见斐波那契: 计算类型(ZigZag/图表范围),显示 ZigZag(默认关闭),所有 ZigZag 参数,稳定锚定与突破重置,所有水平和线条参数,背景填充,反转,对数刻度,标签控制,以及超过 25 个可切换、自定义和重新着色的独立斐波那契水平。
用终极价格行为工具包提升您的交易水平。停止画线,开始发现交易机会。立即获取 LudwigICT 的高级 ICT 专业套件! 🚀🚀🚀
如果您有任何问题或遇到任何问题,欢迎随时联系我。我很乐意帮助您!
免责声明:
使用我的算法即表示您承认交易存在固有风险,过去的表现不保证未来结果。您必须具备稳健的风险管理策略,最重要的是严格遵守止损水平。不正确的风险管理可能导致重大损失。我不对使用这些算法产生的任何财务结果负责。请负责任地交易,并始终遵循正确的风险管理实践。
祝福满满! 🙌
摘要
客户评价
5 | 50 % | |
4 | 50 % | |
3 | 0 % | |
2 | 0 % | |
1 | 0 % |


