
说明
我们搬到了 👉 PrimeQuant
🚫🚫🚫 不要购买这个指标!
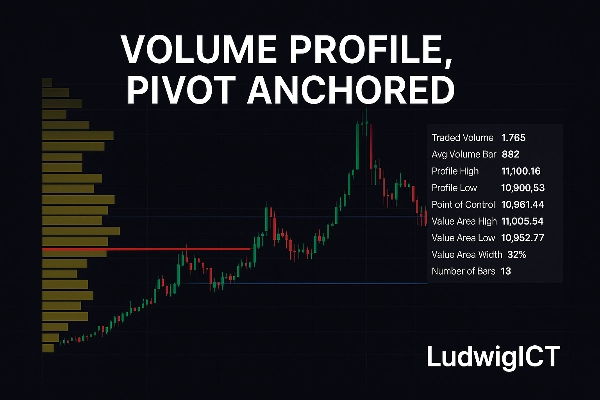
Volume Profile, Pivot Anchored 指标将专业级的市场结构和成交量分析方法直接带入 cTrader。专为重视清晰度、精确性和可操作见解的交易者设计,它揭示了交易活动在有意义的波动范围内如何分布于价格之中。
⚡独家优惠 – 仅限前10位购买者!⚡
利用这个强大的 自定义指标,释放您的交易策略全部潜力,旨在为您提供市场中的精准优势。此工具专为严肃交易者打造,提供 清晰、可操作的信号,并提升在交易 XAU/USD 及其他外汇货币对时的决策能力。
🚀 为什么现在购买:
以 特别启动价提供 – 仅限前 10 位交易者
获得 高级价格行为洞察
专为 高精度和可靠性 设计
完美适用于 剥头皮和波段交易
一旦售出10份,此优惠将 不再以此价格提供。立即锁定您的副本,将交易提升到新高度!
它的功能是什么?
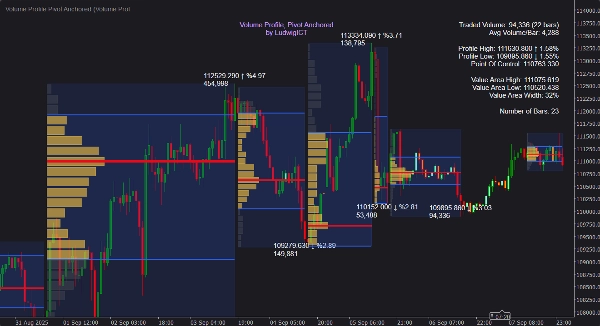
与固定或基于会话的轮廓不同,该工具自动将成交量轮廓锚定到重要的枢轴高点和低点,动态映射每个波动的拍卖过程。这使得可以看到市场参与者实际投入资本的位置——而不仅仅是价格移动的位置。
✨ 关键元素包括:
📍 自动枢轴检测 – 轮廓在波动高点和低点之间构建,随着新枢轴形成而更新。
📊 详细的成交量分布 – 直方图显示成交量如何分配于价格,分辨率和宽度由用户定义。
🎯 价值区和控制点水平 – 即时计算和可视化控制点(POC)、价值区高点(VAH)和价值区低点(VAL)。
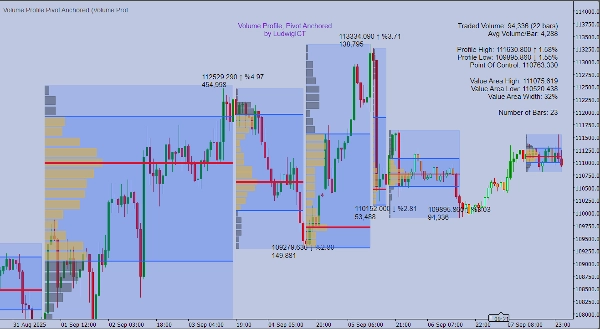
📈 发展中的轮廓 – 当前波段的实时更新轮廓,提供前瞻性背景。
➡️ 延伸控制点区域 – 将控制点向前投射,直到价格触及或穿越,突出未来反应区域。
📝 信息标签和工具提示 – 价格标签、百分比变化、累计成交量及悬停时的清晰统计面板。
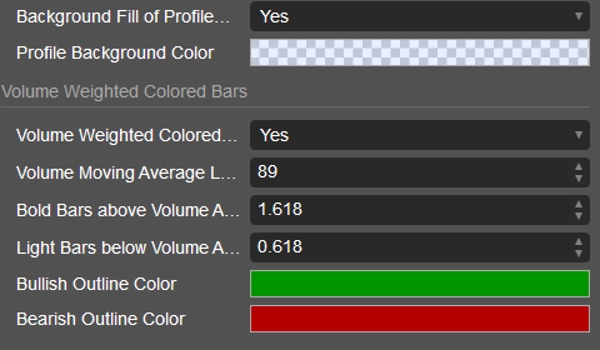
🎨 成交量加权柱状着色 – 根据成交量强度为蜡烛图着色,便于快速识别模式。
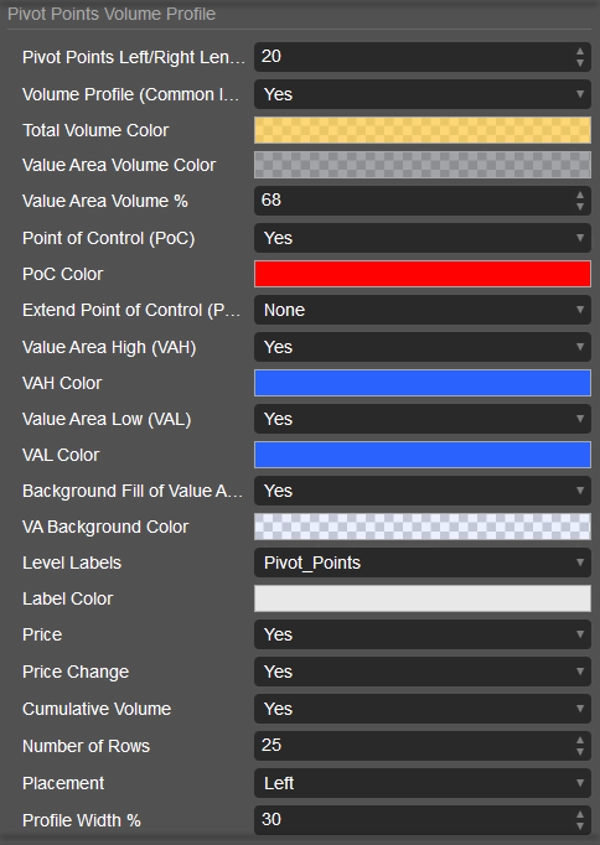
⚙️ 完全自定义 – 调整颜色、位置和显示,完美融入您的图表风格。
如何使用
1️⃣ 附加到任何图表 – 适用于所有时间框架和工具。
2️⃣ 调整枢轴长度 – 控制对波动高点/低点的敏感度(越短=更多轮廓,越长=仅主要结构)。
3️⃣ 在上下文中解读轮廓:
• 🎯 控制点(POC)– 交易量最大的价格水平,通常具有吸引力。
• 📏 价值区高点/低点(VAH / VAL)– 价值区边界,强有力的支撑/阻力。
• 🌀 直方图形状 – 识别平衡区、拒绝区和分布变化。
4️⃣ 观察发展中的轮廓 – 跟踪拍卖结构的实时构建。
5️⃣ 使用提醒 – 当价格与控制点、价值区高点、价值区低点交互或出现高成交量柱时获得通知。
6️⃣ 作为框架应用 – 在基于成交量的水平优化入场,预判反转,并通过成交量结构确认趋势。
交易者为何使用它
该指标将原始成交量转化为有意义的结构。通过锚定轮廓于枢轴点,它适应实时市场动态,而非依赖任意的会话划分。无论是日内、波段还是仓位交易,锚定的成交量分布为决策提供更深层次的清晰度。
关键参数一览
⚙️ 枢轴敏感度 – 定义波动点检测的激进程度。
📊 轮廓水平和宽度 – 控制轮廓分辨率和可见性。
🎯 控制点延伸模式 – 无、直到最后一根柱、直到触及或直到穿越。
📏 价值区百分比 – 完全可调(默认68%)。
🎨 成交量着色 – 用于突出显示强/弱参与度的阈值。
LudwigICT 的 Volume Profile, Pivot Anchored 不是通用的可视化工具——它是洞察市场真实拍卖方式的结构透镜。对于要求专业工具的交易者,它在解读价格与成交量相互作用方面提供了决定性的优势。
如果您有任何问题或遇到任何问题,请随时联系我。我很乐意帮助您!
免责声明:
使用我的算法即表示您承认交易存在固有风险,且过去的表现不保证未来结果。您必须具备稳健的风险管理策略,最重要的是,严格遵守止损水平。未能妥善管理风险可能导致重大损失。我不对使用这些算法产生的任何财务结果负责。请负责任地交易,并始终遵循适当的风险管理实践。
祝福! 🙌
摘要
客户评价
5 | 67 % | |
4 | 33 % | |
3 | 0 % | |
2 | 0 % | |
1 | 0 % |


