
说明
⚠️ 我们已迁移至 👉 PrimeQuant
🚫🚫🚫 请勿购买此指标!
⚡ 下一代版本现已推出: 这款经典的 LudwigICT 工具已重新设计、重构,并以我们的新开发者品牌 PrimeQuant 重新发布。新版本具有简化的用户界面和针对当前市场条件更新的属性。您可以在此处以遗留折扣价获取升级版本:
👉 Elliott Waves 自动检测 + 斐波那契
👉 Elliott Waves 自动检测 + 斐波那契
👉 Elliott Waves 自动检测 + 斐波那契
(请注意:LudwigICT 列表仍对遗留用户开放,但将不再接收更新或有效价格折扣。)
📈 Elliott Wave – 斐波那契水平 [LudwigICT]
🔥 解锁 艾略特波浪理论 与 动态斐波那契回撤 的全部威力——全部在 cTrader 中自动完成!
此指标将专业级的波浪计数和精准的斐波那契区域直接带到您的图表上,使得 趋势预测和交易执行比以往更简单。
✨ 主要特点
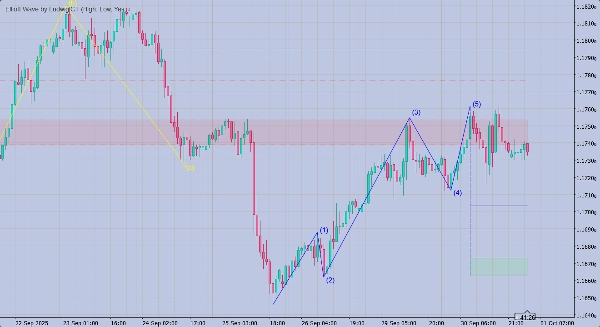
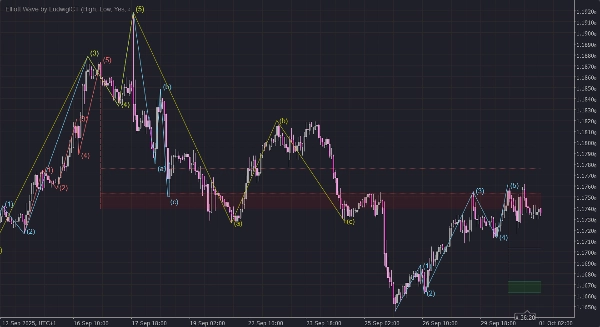
🔹 自动波浪检测
- 识别 5 波推动结构(1–5)。
- 在推动波完成后立即检测 3 波调整形态(A–B–C)。
🔹 动态斐波那契回撤
🔹 多重 ZigZag 框架
- 运行 三个独立的 ZigZag 计算,支持自定义长度和颜色。
- 确保针对不同市场条件的灵敏度灵活调整。
🔹 专业视觉效果
- 清晰的波浪标签
(1)…(5)和(a)(b)(c),基于 ATR 的智能偏移放置。 - 当水平被突破时,使用 粗体 X 标记 的突破框。
- 渐变式斐波那契填充区域,便于识别。
🔹 交易辅助
- 自动识别 可能的新波 (1),在 A–B–C 调整后。
- 针对 新波浪、无效点和突破信号 的音频提醒。
🛠 使用方法
- 应用到图表
-
- 只需拖放 Elliott Wave – Fibonacci Levels [LudwigICT] 到您的 cTrader 图表上。
- 适用于所有时间框架(剥头皮、波段、长期)。
- 自定义参数
- 解读波浪
-
- ✅ 波浪
(1–5)= 推动波(趋势方向)。 - 🔄 波浪
(a–b–c)= 调整波(逆势)。 - 📊 斐波那契水平显示 可能的回撤区域,用于进出场。
- ✅ 波浪
- 自信交易
-
- 在完成推动波后,围绕 斐波那契回撤 进入交易。
- 当水平被突破时管理风险(指标会自动提醒您)。
- 寻找 下一波 (1) 图标,以预判新的趋势周期。
🎯 为什么选择此指标?
✅ 节省大量手动波浪计数时间。
✅ 避免艾略特波浪分析中的主观错误。
✅ 清晰、精准、专业的视觉效果直接显示在您的图表上。
✅ 由 LudwigICT 创建和优化,值得信赖的交易自动化专家。
🖥 兼容性
- 平台: cTrader 桌面版 v5+
- 品种:适用于 外汇、股票、指数、商品、加密货币。
- 时间框架:从 1分钟剥头皮 到 每周波段分析。
⚡️ 立即开始
🚀 今天就将 Elliott Wave – Fibonacci Levels [LudwigICT] 添加到您的交易武器库,提升您的图表分析水平!
👉 非常适合依赖 价格行为、结构和斐波那契回撤 精准把握进出场时机的交易者。
如果您有任何问题或遇到任何问题,欢迎随时联系我。我很乐意帮助您!
免责声明:
使用我的算法即表示您承认交易存在固有风险,过去的表现不保证未来结果。您必须具备稳健的风险管理策略,最重要的是,严格遵守止损水平。未能妥善管理风险可能导致重大损失。我不对使用这些算法产生的任何财务结果负责。请负责任地交易,并始终遵循适当的风险管理规范。
祝福! 🙌
摘要
客户评价
5 | 100 % | |
4 | 0 % | |
3 | 0 % | |
2 | 0 % | |
1 | 0 % |


