説明
Fixed Range Volume Profile - Manualは、選択した時間範囲内の価格ごとにティックの観測をグループ化するcTraderのチャートインジケーターです。フルバージョンでは、ポイント・オブ・コントロール(POC)、バリューエリアハイ(VAH)、バリューエリアロー(VAL)とともにプロファイルを表示します。
範囲を選択
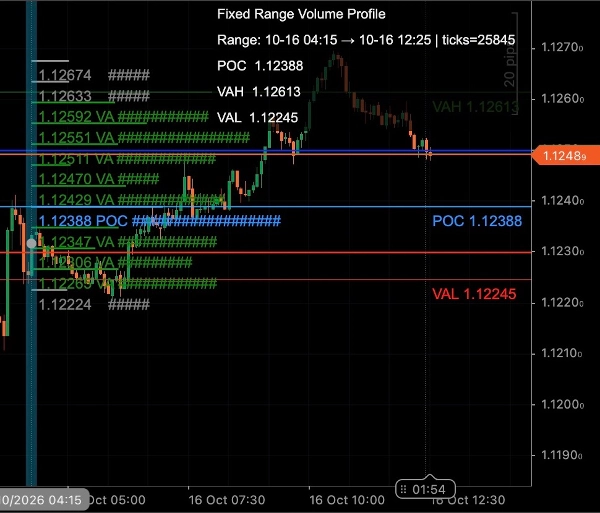
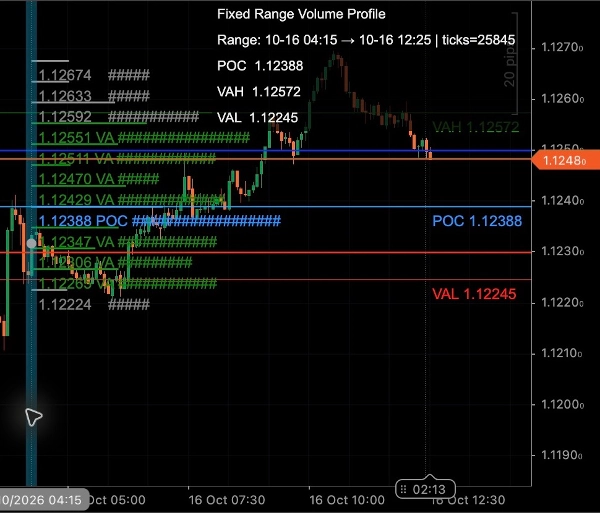
フルインジケーターをチャートに追加し、開始および終了の垂直線を動かして調べたい期間を選択します。その範囲に対してプロファイルとそのレベルが再計算されます。チャートパネルには選択された範囲、含まれるティック観測の数、およびPOC、VAH、VALの価格が表示されます。
プロファイルの設定
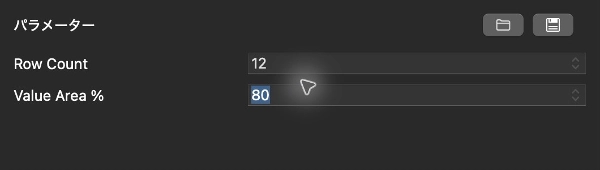
- 行数: 12〜100の価格行;デフォルトは32。
- バリューエリア%: 50〜95%;デフォルトは70%。
POCは最も多くのティック観測がある価格行を示します。バリューエリアはPOCから隣接する行に広がり、設定された割合の観測を含みます。VAHとVALはその上限と下限を示します。
データの理解
利用可能な各ティックは、そのBidとAsk価格の中間点で1つの観測に寄与します。これは取引所で取引された出来高、買い/売り出来高、またはオーダーフローデルタではなく、ティック活動のプロファイルです。
インジケーターは最新の最大100,000ティックを調べ、選択された時間範囲内のものを含みます。したがって結果はブローカーのティック履歴とcTraderに読み込まれたデータに依存します。範囲を選択しても、その期間の完全なティック履歴が利用可能であることは保証されません。
始め方
1. 購入したインジケーターを、購入に使用したのと同じcTrader IDでcTrader Desktopにインストールします。Algo > Indicatorsを開き、Fixed Range Volume Profile - Manualを選択し、シンボルと時間枠のインスタンスを追加します。チャートのインジケーターセレクターからも添付可能です。
2. インスタンスのパラメータパネルで、行数とバリューエリア%を設定するか、デフォルトのままにします。行数は価格ビンの解像度を変更し、バリューエリア%はバリューエリアに使用されるティック観測の割合を変更します。
3. インジケーターの開始および終了の垂直線を選択してドラッグし、時間範囲を選びます。境界を動かした後、右上のパネルに表示される範囲の日付を確認してください。
4. チャートパネルで選択された範囲とティック数とともに、プロファイル、POC、VAH、VALを読み取ります。
このインジケーターは分析ツールです。取引の発注や管理は行わず、表示されたレベルでの価格反応を予測するものではありません。
スクリーンショットの読み方
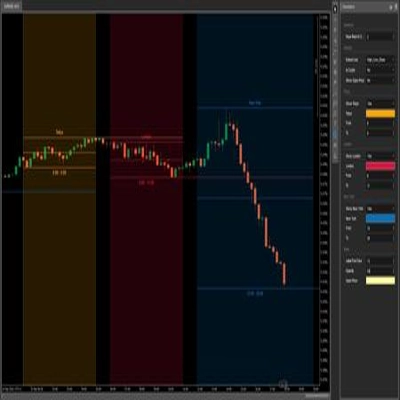
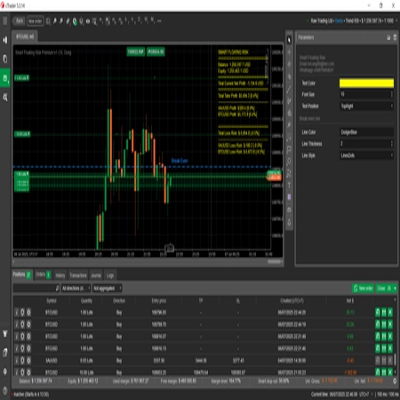
70%バリューエリアのチャートは、選択された範囲と70%バリューエリアでの水平ティック活動プロファイルを示します。80%バリューエリアのチャートは、80%バリューエリアでのPOC、VAH、VALを示します。青はPOC、緑はバリューエリアの行とVAH、赤はVALを示します。灰色の行はバリューエリア外です。設定画像は実際の行数とバリューエリア%のコントロールを示し、80%の例では12と80に設定されています。これらは例示的な設定であり、デフォルトではありません。チャートには通常の価格ローソク足と現在価格マーカーも含まれており、インジケーターは取引シグナルを生成しません。
制限事項
ティック活動はブローカーが提供する見積もり更新を表し、取引された契約数や株数を示すものではありません。異なるブローカーや利用可能な履歴により異なるプロファイルが生成されることがあります。古いまたは利用できない履歴により、選択された範囲が不完全になる場合があります。表示されたレベルは選択された観測を示すものであり、サポート、レジスタンス、将来の価格を保証するものではありません。別途ストアの試用版は提供されていません。
概要
Users add the indicator to a chart and adjust start and end vertical lines to select the analysis period. The profile recalculates dynamically for the chosen range, showing the number of tick observations and key levels in the chart panel. Configuration options include setting the number of price rows (12 to 100) and the value area percentage (50% to 95%), affecting the profile’s resolution and value area size.
The indicator uses tick data representing quote updates at the midpoint between bid and ask prices, not actual traded volume or order flow. It processes up to 100,000 recent ticks depending on broker data availability. This tool provides visual insight into price-level activity but does not generate trade signals or manage orders.
ディスカッション
カスタマーレビュー
5 | 50 % | |
4 | 50 % | |
3 | 0 % | |
2 | 0 % | |
1 | 0 % |