present
ลงทะเบียนและรับส่วนลด $50 สำหรับการซื้อครั้งแรกของคุณ
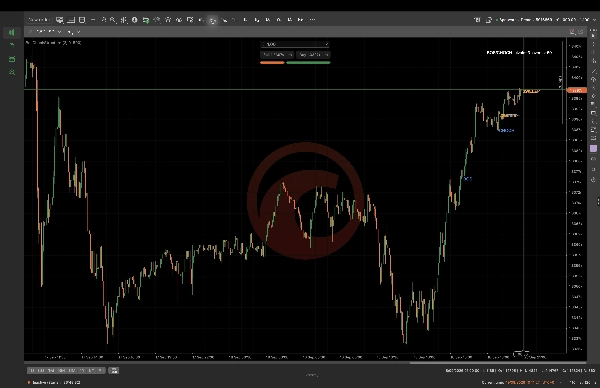
Trading product for BOS CHOCH Structure อินดิเคเตอร์ Key Levels MSS, image 1
BOS CHOCH Structure
อินดิเคเตอร์
เวอร์ชัน 1.0, Sep 2026
Windows, Mac
4.5
รีวิว: 4
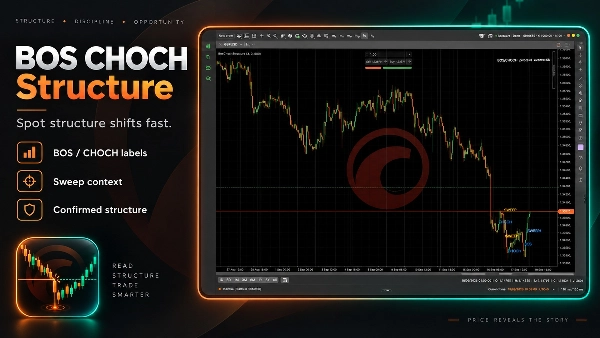
Trading product for BOS CHOCH Structure อินดิเคเตอร์ Key Levels MSS, image 2
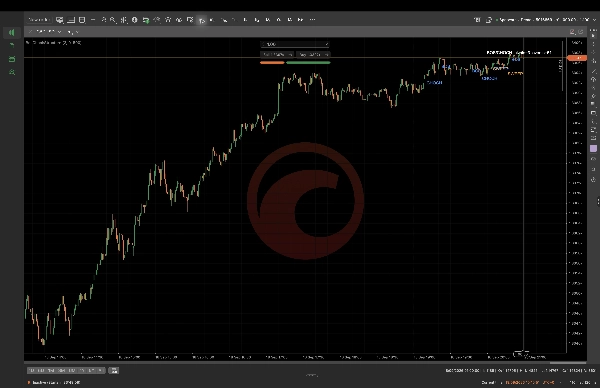
Trading product for BOS CHOCH Structure อินดิเคเตอร์ Key Levels MSS, image 3
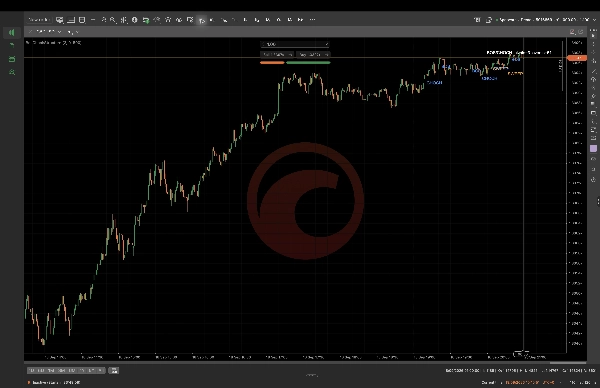
Trading product for BOS CHOCH Structure อินดิเคเตอร์ Key Levels MSS, image 4
Trading product for BOS CHOCH Structure อินดิเคเตอร์ Key Levels MSS, image 5
Trading product for BOS CHOCH Structure อินดิเคเตอร์ Key Levels MSS, image 6
Trading product for BOS CHOCH Structure อินดิเคเตอร์ Key Levels MSS, image 7
Trading product for BOS CHOCH Structure อินดิเคเตอร์ Key Levels MSS, image 8
Trading product for BOS CHOCH Structure อินดิเคเตอร์ Key Levels MSS, image 9
ตั้งแต่ 16/09/2026

คำอธิบาย

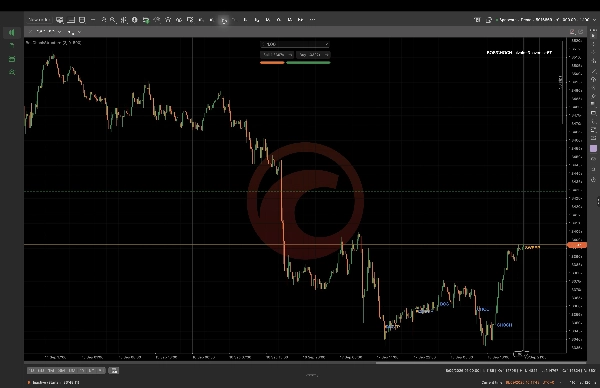
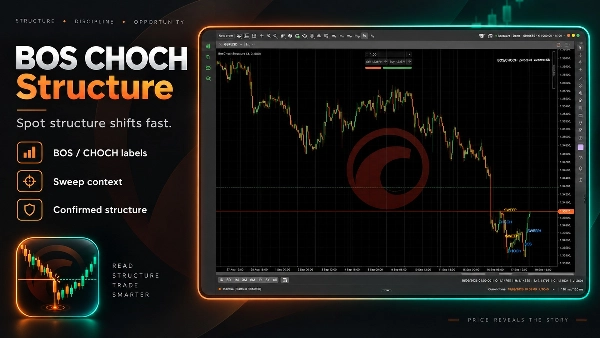
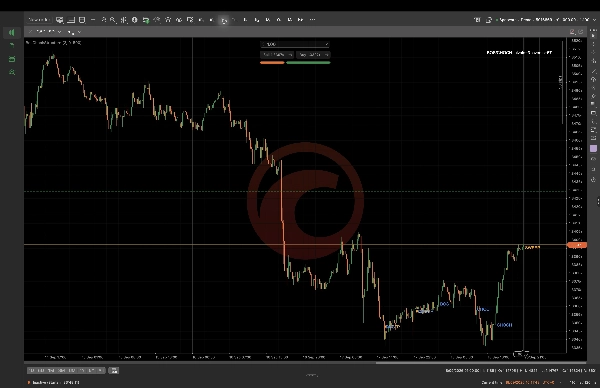
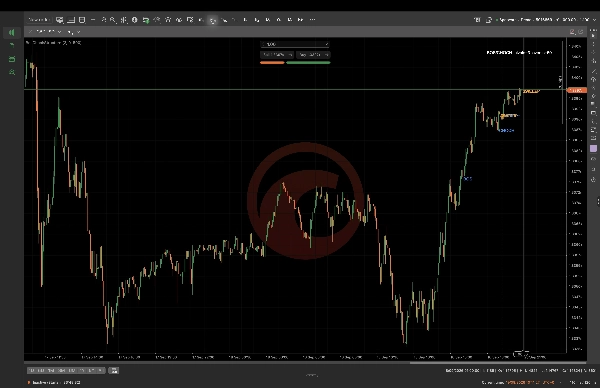
โครงสร้าง BOS CHOCH เป็นตัวบ่งชี้ cTrader สำหรับการอ่านโครงสร้างตลาดที่ได้รับการยืนยันบนแผนภูมิราคา โดยวิเคราะห์แท่ง OHLC และจุดหมุนที่ได้รับการยืนยัน จากนั้นทำเครื่องหมาย Break of Structure (BOS), Change of Character (CHOCH) และเหตุการณ์ wick Sweep เป็นคำอธิบายภาพบนแผนภูมิ ใช้ความแข็งแกร่งของจุดหมุน, บัฟเฟอร์การแตกหัก และความลึกของประวัติศาสตร์เพื่อปรับมุมมองสำหรับเครื่องมือและช่วงเวลาที่คุณต้องการ มีวัตถุประสงค์สำหรับการวิเคราะห์แผนภูมิแบบดุลยพินิจในตลาดฟอเร็กซ์และดัชนี รวมถึงการทบทวนแบบอินทราเดย์และกรอบเวลาที่สูงกว่า ป้ายกำกับเป็นเครื่องมือช่วยยืนยัน ไม่ใช่การทำนายหรือการดำเนินการซื้อขายอัตโนมัติ สัญญาณขึ้นอยู่กับข้อมูลแท่งที่เสร็จสมบูรณ์และพารามิเตอร์ที่เลือก ตัวบ่งชี้นี้ไม่ทำการวางคำสั่งหรือรับประกันผลลัพธ์

สรุป

สรุปโดย AI
BOS CHOCH Structure is a cTrader indicator designed to identify and display confirmed market structure events directly on price charts. It analyzes OHLC bars and confirmed pivot points to visually mark Break of Structure (BOS), Change of Character (CHOCH), and wick Sweep events as on-chart annotations. Users can adjust parameters such as pivot strength, break buffer, and history depth to customize the indicator’s sensitivity for various instruments and timeframes. The tool supports discretionary analysis primarily for forex and index markets, suitable for both intraday and higher timeframe reviews. It provides confirmation aids based on completed-bar data but does not generate predictive signals or execute trades automatically. This indicator focuses on visualizing key market structure shifts and liquidity grabs to assist traders in their chart analysis.
โปรไฟล์อินดิเคเตอร์
หมวดหมู่อินดิเคเตอร์
โครงสร้างตลาด (SMC)
ประเภทเอาต์พุต
การแสดงเป็นภาพ
ข้อกำหนดด้านข้อมูล
แท่งเท่านั้น
สัญญาณที่รองรับ
Breakout
Reversal

การสนทนา

รีวิวจากลูกค้า

4.5
รีวิว: 4
5
50 %
4
50 %
3
0 %
2
0 %
1
0 %
รีวิวจากลูกค้า
October 26, 2026
Confirmed pivots, completed candles and an adjustable break buffer give the BOS, CHoCH and wick sweep labels a clear, inspectable basis rather than an undefined notion of market structure.
October 20, 2026
Wick sweeps beside confirmed structure give the chart some welcome nuance. Pivot strength and the break buffer define what is significant. The overlay has clear rules to inspect rather than another unexplained claim to know the next break.
October 14, 2026
The break buffer and pivot strength let the meaning of structure be adjusted openly. BOS and CHoCH follow completed candles and confirmed pivots. That makes the markings fairly transparent instead of hiding their sensitivity behind a label.
October 12, 2026
Confirmed pivots and completed bars give the BOS and CHoCH labels a reasonably clear foundation. Pivot strength and the break buffer expose sensitivity, with wick sweeps recorded as structural events rather than forecasts of the next move.

คำถามที่พบบ่อย

Key Levels
MSS
BOS
CHOCH
Market Structure
Liquidity Grab
ผลิตภัณฑ์ที่มีให้บริการผ่าน cTrader Store รวมถึงบอทการเทรด อินดิเคเตอร์ และปลั๊กอิน มีให้บริการโดยนักพัฒนาบุคคลที่สามและมีไว้เพื่อวัตถุประสงค์ในการเข้าถึงข้อมูลและทางเทคนิคเท่านั้น cTrader Store ไม่ใช่โบรกเกอร์และไม่ได้ให้คำแนะนำการลงทุน คำแนะนำส่วนบุคคล หรือการรับประกันผลการดำเนินงานในอนาคต

เพิ่มเติมจากผู้เขียนคนนี้

อินดิเคเตอร์
BOS
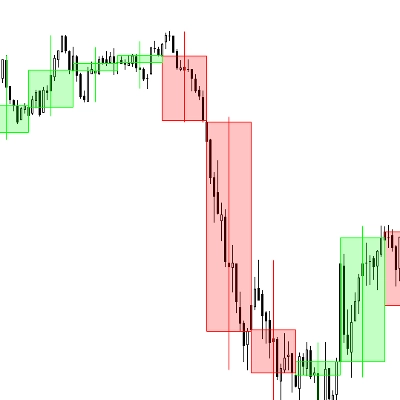
Add standard-timeframe context candles to a native Renko chart.
อินดิเคเตอร์
EMA
Volume
Map range high, mid, low, price location and a deterministic pressure proxy on your cTrader chart.
อินดิเคเตอร์
Channel
Key Levels
+1
Monitor a selected chart trendline and confirm breaks on candle close.
ปลั๊กอินเดสก์ท็อป
Trade Journal
Trade Statistics
Review daily PnL, trade counts, losing streaks and rapid re-entry from your cTrader history.
ปลั๊กอินเดสก์ท็อป
Chart UI Tools
Keep lines, zones and channels synced across selected same-symbol charts from one desktop plugin.
cBot
Drawdown Guard
Daily Loss Limit
Monitor account-wide loss and stop-loss risk budgets, with optional order cancellation and post-fill closure.
ปลั๊กอินเดสก์ท็อป
Position Sizer
Risk Calculator
Size manual trades from your risk settings and review Market, Limit or Stop orders before execution.
อินดิเคเตอร์
Volume
Key Levels
View tick activity across a selected chart range with Point of Control, Value Area High and Value Area Low.

นอกจากนี้คุณยังอาจชอบ

อินดิเคเตอร์
ATR
BOS
+5
Opening ranges, dynamic trend channels, and multi-scale breakout/retest analysis for clear intraday chart decisions.
"Trend Sniper" โลโก้
ยอดนิยม
4.3
(3)
$19
/
$29
อินดิเคเตอร์
Prop
Forex
+9
Trend Sniper — session-based tool highlighting live session ranges and adaptive Custom line.
อินดิเคเตอร์
EMA
RSI
+5
MACD Colour Histogram with 11 Moving Average Types, Multi-timeframe confirmation and Sound Signal Alert.
อินดิเคเตอร์
AI
BOS
+4
Golden Boom and Crash Spike Detector is a trading tool designed for Crash 300 and Boom 300 indices on M1 Timeframe.
"Major Tops and Bottoms" โลโก้
เรตติ้งสูง
4.2
(4)
$29
อินดิเคเตอร์
Signal
Scalping
Average accuracy of around 60% to 70% on 45min timeframes it is highly recommended to use stop losses
อินดิเคเตอร์
Prop
Forex
+13
Decision System Indicator According to Cosmic Laws
อินดิเคเตอร์
Key Levels
Support & Resistance
Add your provider's gamma levels by hand or automatically with our feed plugin, and see the gamma regime at a glance.
อินดิเคเตอร์
AI
RSI
+7
Multi-asset screener with real-time RSI/volatility analysis, interactive dashboard, and color-coded trading signals.
อินดิเคเตอร์
Indices
Custom ADX Indicator for precise trend analysis. المؤشر المخصص ADX لتحليل الاتجاه بدقة
"TradingViewMACD" โลโก้
ยอดนิยม
5.0
(1)
$19
/
$20
อินดิเคเตอร์
MACD
Signal
Enhance your trading strategy with our customizable TradingViewMACD indicator. Optimize and elevate your market analysis
อินดิเคเตอร์
Forex
Multi-timeframe candlesticks!
อินดิเคเตอร์
SMC
Forex
+4
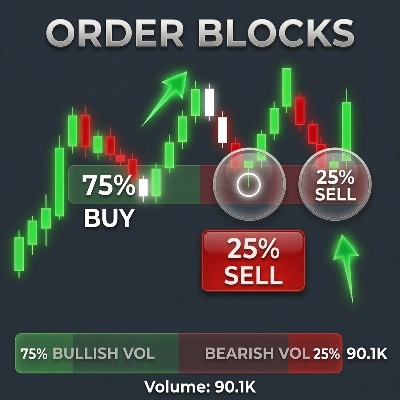
Identifies institutional zones with Volume Delta (K) across any asset or chart for high-precision entry detection.
อินดิเคเตอร์
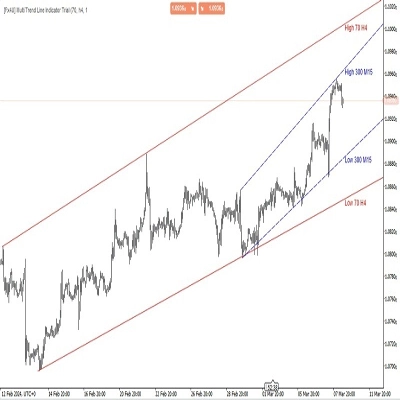
Allow trader to draw multi trendlines in different timeframes on one chart,Give trader an overview of the current market
"BubbleXRay" โลโก้
ยอดนิยม
4.0
(4)
$19
/
$29
อินดิเคเตอร์
Volume
Imbalance
+5
Spot Institutional Order Flow with Proportional Volume Bubbles & Integrated Cumulative Volume Delta (CVD) Intelligence.
อินดิเคเตอร์
ATR
Key Levels
+1
Explore 88 harmonic price-pattern variants with interactive chart controls and geometric reference levels.
"ADXMultiframeIndicator" โลโก้
เรตติ้งสูง
4.7
(4)
$19
/
$29
อินดิเคเตอร์
Indices
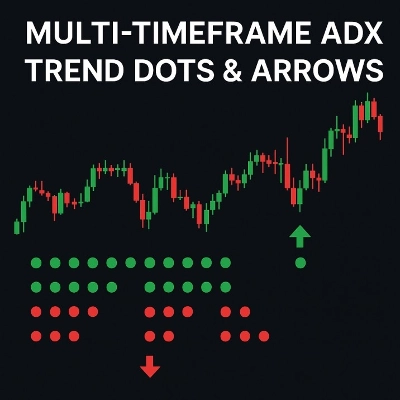
Multi-Timeframe ADX Trend Dots & Arrows
"SessionPowerZonesPro" โลโก้
ยอดนิยม
5.0
(4)
$19
/
$20
อินดิเคเตอร์
Highlights market sessions & overlaps with real-time range & volume stats – perfect for pro scalpers.
"RangePulsePro" โลโก้
ใหม่
5.0
(1)
$35
อินดิเคเตอร์
Risk Dashboard
AI-powered daily range forecasts help traders spot volatility opportunities and plan stops and targets.

ราคา

ตั้งแต่ 16/09/2026