
Range Pressure Map
Gösterge
Sürüm 1.0, Sep 2026
Windows, Mac
5.0
Değerlendirmeler: 2
Başlangıç 16/09/2026
Açıklama
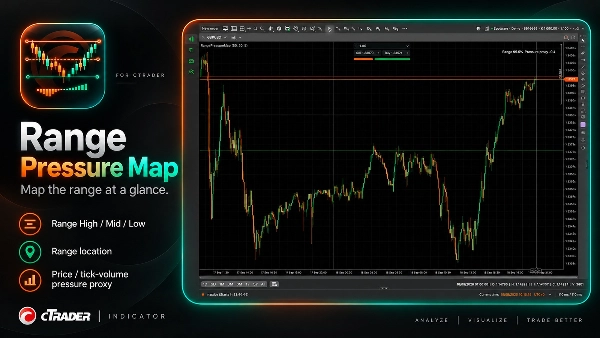
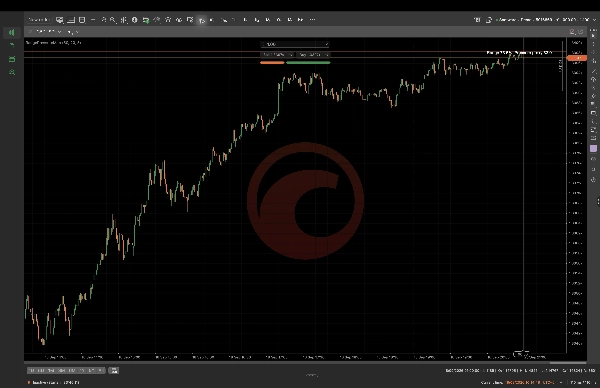
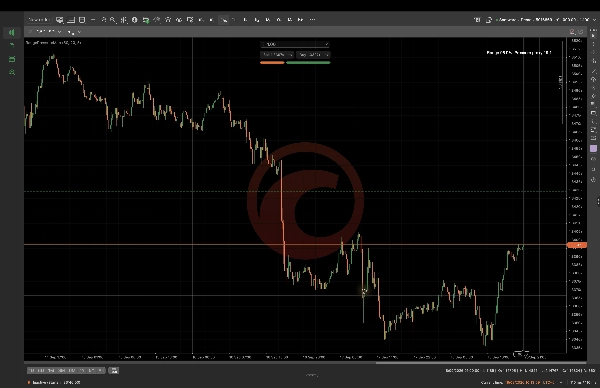
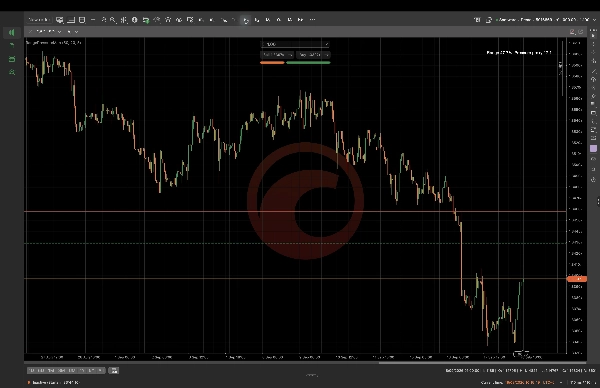
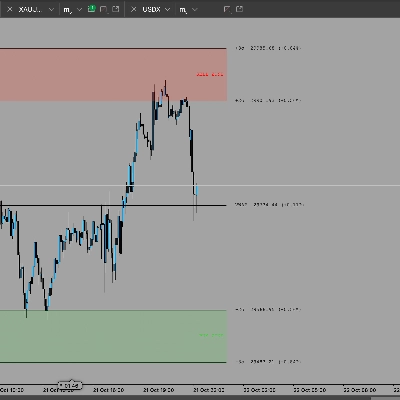
Range Pressure Map, bir geriye dönük aralık hesaplar ve Aralık Yüksek, Aralık Orta ve Aralık Düşük değerlerini mevcut fiyat konumu ve deterministik bir tik-hacim basınç vekili ile birlikte gösterir. İncelediğiniz grafik bağlamına uyacak şekilde aralık geriye dönük, basınç geriye dönük ve EMA uzunluğunu yapılandırın. Bu, isteğe bağlı grafik analizi için tasarlanmıştır ve sipariş akışını, gerçek piyasa hacmini, alıcı veya satıcı faaliyetini, tahminleri veya otomatik işlem yürütmeyi temsil etmez. Değerler seçilen sembol, zaman dilimi, parametreler ve mevcut verilere bağlıdır.
Özet
YZ özeti
Range Pressure Map is a cTrader indicator that calculates a lookback range and visually displays the Range High, Range Mid, and Range Low levels on your chart. It also shows the current price location within this range alongside a deterministic tick-volume pressure proxy, which serves as an estimate of market pressure based on tick volume data. Users can customize parameters including range lookback period, pressure lookback, and EMA length to align with their specific chart context. This tool is intended for discretionary chart analysis and does not provide order flow data, real market volume, buyer or seller activity, predictive signals, or automated trade execution. Its outputs depend on the selected trading symbol, timeframe, and input parameters. The indicator supports visualization of support and resistance levels combined with volume-based pressure insights to assist traders in analyzing price action within defined ranges.
Gösterge profili
Gösterge kategorisi
Destek ve direnç
Çıktı türü
Görselleştirme
Veri gereklilikleri
Yalnızca çubuklar
Tartışma
Müşteri değerlendirmeleri
5.0
Değerlendirmeler: 2
5 | 100 % | |
4 | 0 % | |
3 | 0 % | |
2 | 0 % | |
1 | 0 % |
Müşteri değerlendirmeleri
October 20, 2026
Range Pressure Map provided a clean and consistent range view on EURUSD and XAUUSD across H1 and M1. High, Mid and Low levels were clearly plotted, while the displayed range percentage matched the visible price location well. The pressure proxy added context without cluttering the chart or being presented as true order flow. Score 4,7/5
October 7, 2026
A range high, midpoint and low put the pressure proxy in a clear setting. Lookback and EMA controls make the view adjustable, and the description is upfront about using tick volume rather than real buyer and seller flow. That honesty makes the map easier to interpret.
SSS
EMA
Volume
cTrader Store üzerinden erişilebilen işlem botları, göstergeler ve eklentiler gibi ürünler, üçüncü taraf sağlayıcılar tarafından sağlanır ve yalnızca bilgilendirme ve teknik erişim amaçlarıyla sunulur. cTrader Store bir broker değildir ve yatırım tavsiyesi, kişisel öneriler vermez veya gelecekteki performansı garanti etmez.












Fiyat
Başlangıç 16/09/2026