
Opis
Ten wskaźnik nakłada pogrubione, łatwe do odczytania panele świecowe z dwóch wyższych interwałów czasowych — w pełni konfigurowalne — bezpośrednio na Twój wykres. Natychmiast wizualizuj strukturę rynku, trend i momentum na wyższym interwale czasowym bez przełączania wykresów.
Funkcje:
• Wyświetlanie dwóch konfigurowalnych paneli (dowolne interwały czasowe) obok siebie
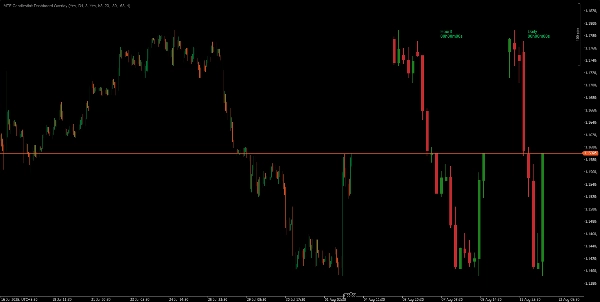
• Odliczanie czasu w czasie rzeczywistym do następnej świecy dla każdego interwału
• Czyste, wypełnione świece z kolorowaniem byków/niedźwiedzi i pogrubionymi knotami
• Kontrola użytkownika nad pozycją panelu, rozmiarem, odstępami i liczbą świec
• Brak opóźnień, działa na dowolnym interwale czasowym lub symbolu
Idealny dla traderów, którzy wymagają jasnego przeglądu wielu interwałów czasowych na pierwszy rzut oka.
Nigdy więcej nie przegap kluczowej zmiany struktury HTF — zobacz pełny obraz bezpośrednio na swoim wykresie handlowym!
Moje inne produkty
- Institutional FVG Zones MTF with Confluence
- All-in-One Session Levels Suite
- MARKET_STRUCTURE BOS_CHoCH
- Multi_TF Candlestick Chart Overlay
- ICT Killzones & Macros
- ICT_SMC_ToolKit
- VWAP_MTF
- Traders Dynamic Index (TDI)
- Market_Session_Forex
Zastrzeżenie: Handel wiąże się z ryzykiem, a wyniki z przeszłości nie gwarantują przyszłych rezultatów. Stosuj odpowiednie zarządzanie ryzykiem, przestrzegaj poziomów stop-loss i handluj odpowiedzialnie. Nie ponoszę odpowiedzialności za jakiekolwiek straty finansowe wynikające z korzystania z tych algorytmów. Używaj tych wskaźników jako elementu swojej konfluencji i zmniejsz obciążenie czasowe związane z oznaczaniem wykresów.
Podsumowanie
Opinie klientów
5 | 50 % | |
4 | 50 % | |
3 | 0 % | |
2 | 0 % | |
1 | 0 % |


