Opis
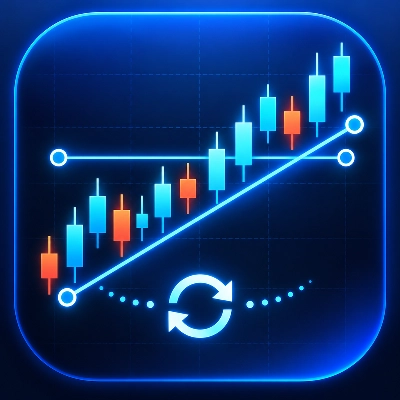
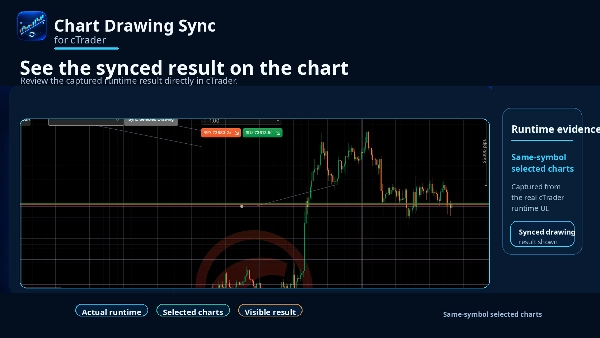
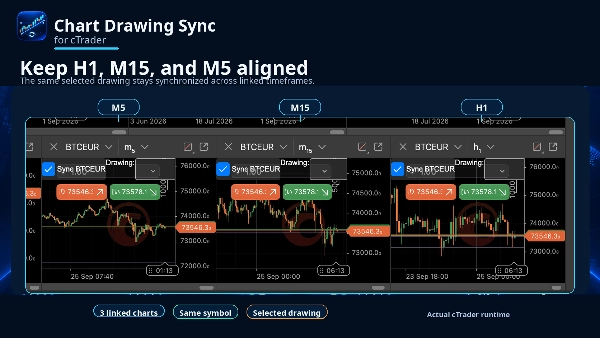
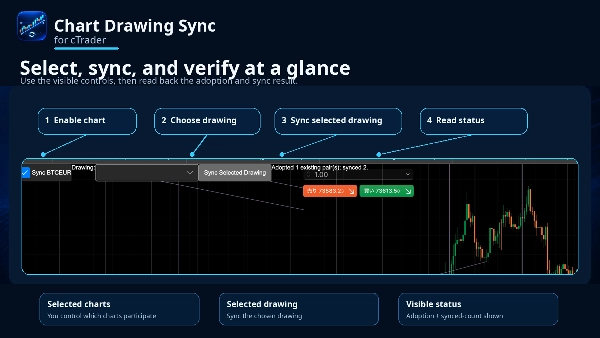
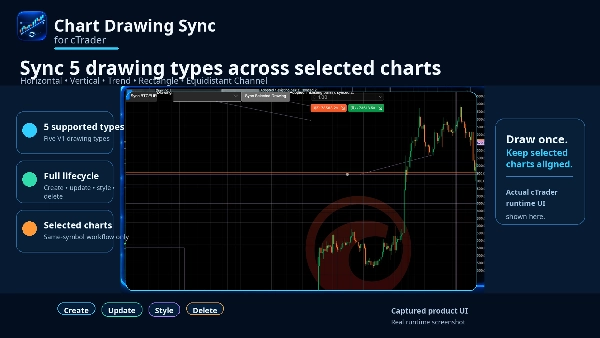
Keep your chart analysis aligned without redrawing the same objects on every timeframe. Chart Drawing Sync is a native cTrader Desktop plugin that synchronizes five commonly used drawing types across the same-symbol charts you choose. Create or edit a drawing on any participating chart and its time/price geometry, supported styling, and deletion are synchronized with the corresponding drawings on the other selected charts. Use Horizontal Lines, Vertical Lines, Trend Lines, Rectangles, and Equidistant Channels across views such as H1, M15, and M5. Synchronization is bidirectional, so you can continue working from whichever participating timeframe has the clearest context. The plugin is deliberately selective. It only works between user-selected charts for the same symbol. Existing drawings are not copied indiscriminately at startup; use Sync Selected Drawing when you explicitly want to adopt an existing drawing. If a target contains an unrelated object with the same name, the plugin fails closed, skips that target, and shows a conflict status instead of overwriting it. Rapid drawing changes are coalesced to avoid recursive update storms. Newly opened chart frames can participate, closed frames are unsubscribed, and stopping the plugin stops synchronization without deleting your drawings. The Full version does not impose the Trial version's two-chart product limit. The Trial version provides the same five drawing types and the same create, update, style, and delete workflow for up to two participating charts. Chart Drawing Sync is an analysis workflow tool. It does not place trades, create signals or alerts, synchronize different symbols, or provide Web, Mobile, or cross-device synchronization.








![Logo „Custom Timeframes [Iridio Capital]”](https://cdn.ctrader.com/image/webp/4d75a920-23c7-4fea-a7b5-594a9d067f2e_63286)